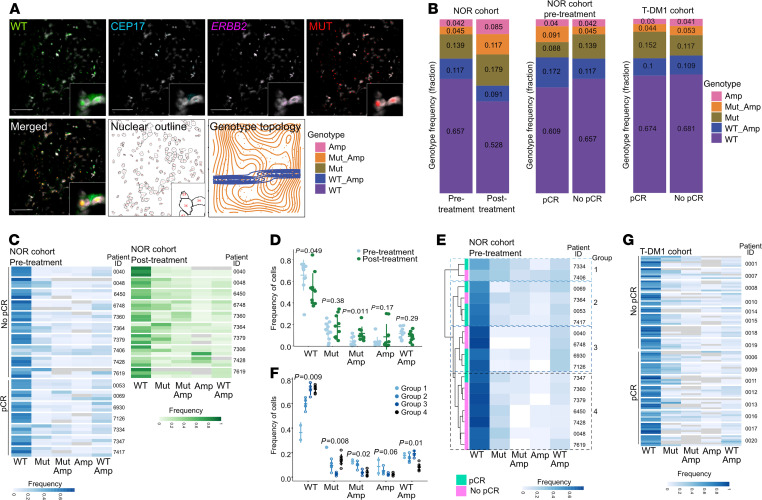
Figure 1. Cellular genetic heterogeneity in neoadjuvant HER2-targeted treatment patient cohorts.
(A) Representative image of STAR-FISH analysis. Nuclear outline image and topological map of the sample are shown. Scale bars: 50 μm. WT, PIK3CA wild-type STAR-FISH signal; CEP17, chromosome 17 centromeric probe; ERBB2, ERBB2-specific FISH probe; MUT, PIK3CA mutant; Amp, amplification of ERBB2. (B) Summary of frequencies of cells with distinct genotypes in Norwegian (NOR) and T-DM1 cohorts. pCR, pathological complete response; No pCR, no pathological complete response. (C) Frequencies of cells with distinct genotypes in each analyzed sample from NOR cohort. Each row corresponds to a single image analyzed (n = 3 per case). Gray represents a frequency of 0. Images are grouped according to the patient ID, and patient IDs are grouped according to response (left). For nonresponders, frequency of genotypes after treatment is also shown (right). (D) Average genotype frequency in pre- versus posttreatment samples from NOR cohort. P values from a Wilcoxon test comparing the change in frequency pre- and posttreatment to 0. (E) Unsupervised clustering of frequencies of cells with distinct genotypes per patient in pretreatment samples from Norwegian cohort. Samples are colored according to response. (F) Differences in genotype frequencies between groups identified in (E). P values from Kruskal-Wallis test. (G) Frequencies of cells with distinct genotypes in each analyzed sample from T-DM1 cohort. Images are grouped according to the patient ID, and patient IDs are grouped according to response.

