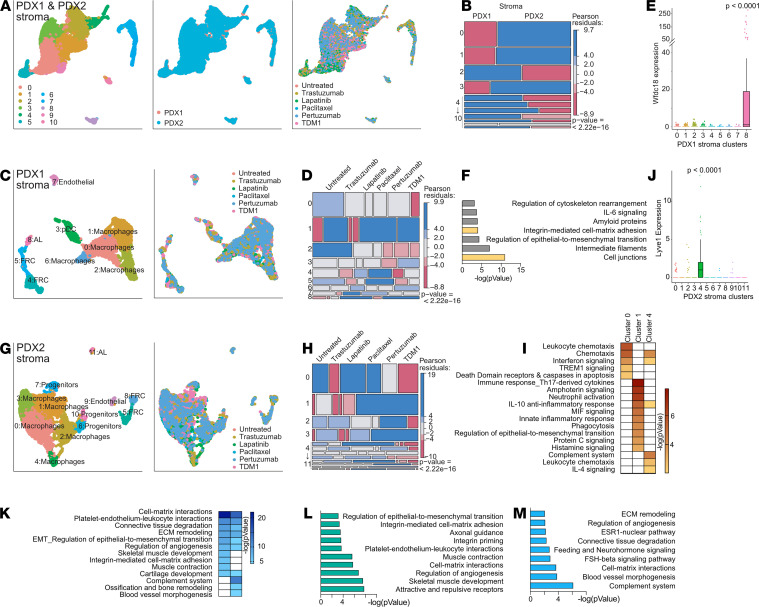
Figure 6. Stromal cell analysis by scRNA-Seq reveals distinct cell types contributing to differential drug response.
(A) Combined analysis of stromal cells from n = 2 samples per each PDX and each condition (total 24 samples, average cell number per sample = 2169). UMAP plots colored by cluster (left panel), PDX (middle panel), and treatment (right panel). (B) Cell distribution among clusters based on PDX from which they were derived. (C) Analysis of stromal cells from PDX1. UMAP plots colored by cluster (left) and treatment (right). AL, alveolar luminal cells; pDC, plasmacytoid dendritic cells; FRCs, fibroblastic reticular cells. (D) Stromal cells from PDX1 distribution among clusters based on treatment. (E) Expression of Wfdc18 in different clusters of PDX1 stromal cells (log-normalized expression values). Unpaired 2-tailed Student’s t tests P value of comparison of cluster 8 to each of the other clusters is shown. (F) MetaCore GO Processes upregulated in AL cluster. (G) Analysis of stromal cells from PDX2. UMAP plots colored by cluster (left) and treatment (right). (H) Stromal cells from PDX2 distribution among clusters based on treatment. (I) GO Processes upregulated in 3 PDX2 macrophage clusters 0, 1, and 4. (J) Expression of Lyve1 in different clusters of PDX1 stromal cells (log-normalized expression values). Unpaired 2-tailed Student’s t tests P value of comparison of cluster 4 with each of the other clusters. (K) GO processes upregulated in 2 PDX2 FRC clusters 5 and 8. (L) GO processes upregulated in cluster 5 compared with cluster 8. (M) GO processes upregulated in cluster 8 compared with cluster 5. (B, D, and H) Red color, lower than expected frequency; blue, higher than expected. P value of χ2 test is shown.

