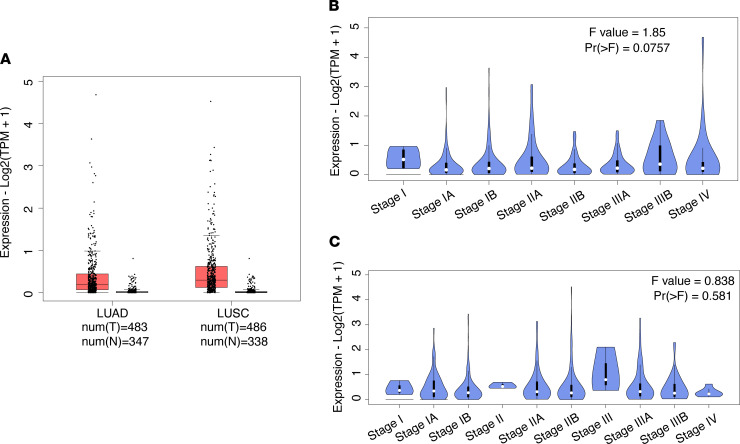
Figure 2. Expression of TERT in lung cancer.
(A) TERT expression in lung carcinoma and normal samples from TCGA and the GTEx project. LUAD: tumor n = 483, normal n = 347; LUSC: tumor n = 486, normal n = 338. (B) Expression levels of TERT at different stages of LUAD; Pr > F = 0.0757. (C) Expression levels of TERT at different stages of LUSC; Pr > F = 0.581. One-way ANOVA was used for statistical analysis.

