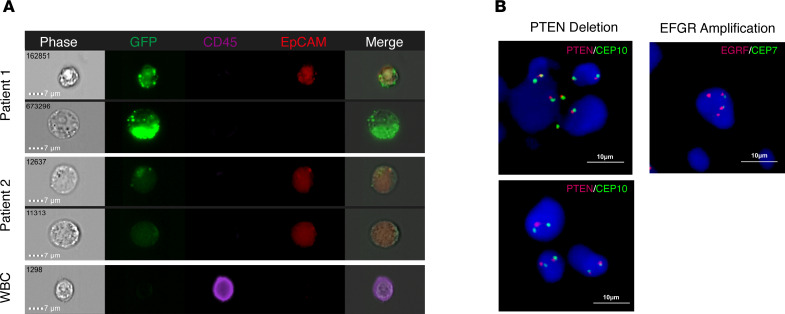
Figure 4. CTC confirmation via FISH and FlowSight.
(A) CD45-eFluor405 (purple), hTERTp-GFP (green), EpCAM (red), and bright-field digital images are shown for CTCs and WBCs. CTCs derived from malignant nodules are marked by GFP with or without the EpCAM marker. CTCs were defined as CD45–/GFP+/EpCAM+ or CD45–/GFP+/EpCAM– cells. WBCs were only marked with CD45. Scale bar: 7 μm. (B) Dual-color FISH results of the PTEN (10q23.3) heterozygous deletion and EGFR (7p11.2) amplification in CTCs from patients with malignant pulmonary nodules. Scale bar: 10 μm.

