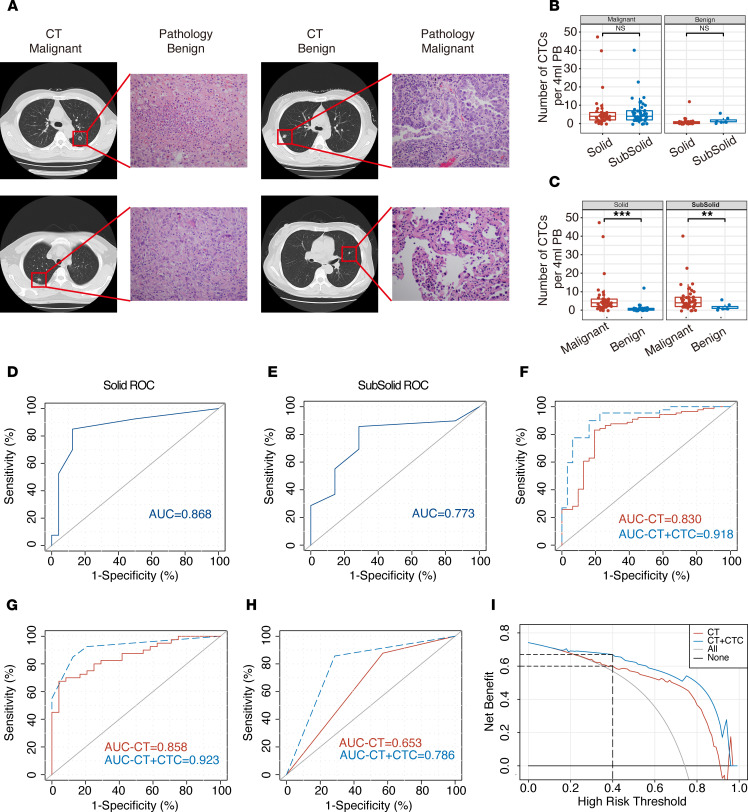
Figure 6. Comparison of TBCD with CT in the enrolled patient cohort.
(A) The results of a typical CT examination were inconsistent with those of postoperative pathology. Total original magnification, ×200. (B) The average numbers of CTCs detected in patients with malignant or benign nodules with different densities. Malignant (solid, n = 40; subsolid, n = 49); benign (solid, n = 24; subsolid, n = 7). Statistical analysis performed with nonparametric Mann–Whitney U test; P = 0.77 and P = 0.44, respectively. (C) The average numbers of CTCs detected in patients with different types of malignant or benign nodules. Solid (malignant, n = 40; benign, n = 24); subsolid (malignant, n = 49; benign, n = 7); P = 0.0018 and P = 0.003, respectively. Statistical analysis performed with nonparametric Mann–Whitney U test; **P < 0.01; ***P < 0.001. (D) ROC curve analysis of the numbers of CTCs in patients with solid nodules. AUC = 0.868; 95% CI, 0.769–0.967. (E) ROC curve analysis of the numbers of CTCs in patients with subsolid nodules. AUC = 0.773; 95% CI, 0.599–0.946. (F) ROC curve analysis of CT and CT combined with CTCs in the enrolled patients with pulmonary nodules. AUC-CT = 0.830; 95% CI, 0.741–0.919. AUC-CT + CTC = 0.918; 95% CI, 0.858–0.977. (G) ROC curve analysis of CT and CT combined with CTCs in patients with solid nodules. AUC-CT = 0.858; 95% CI, 0.770–0.947. AUC-CT + CTC = 0.923; 95% CI, 0.857–0.989. (H) ROC curve analysis of CT and CT combined with CTCs in patients with subsolid nodules. AUC-CT = 0.653; 95% CI, 0.410–0.896. AUC-CT + CTC=0.786; 95% CI, 0.580–0.991. (I) Decision curve analysis for pulmonary nodule diagnosis. Red line, CT diagnosis only; blue line, CT combined with CTC diagnosis.

