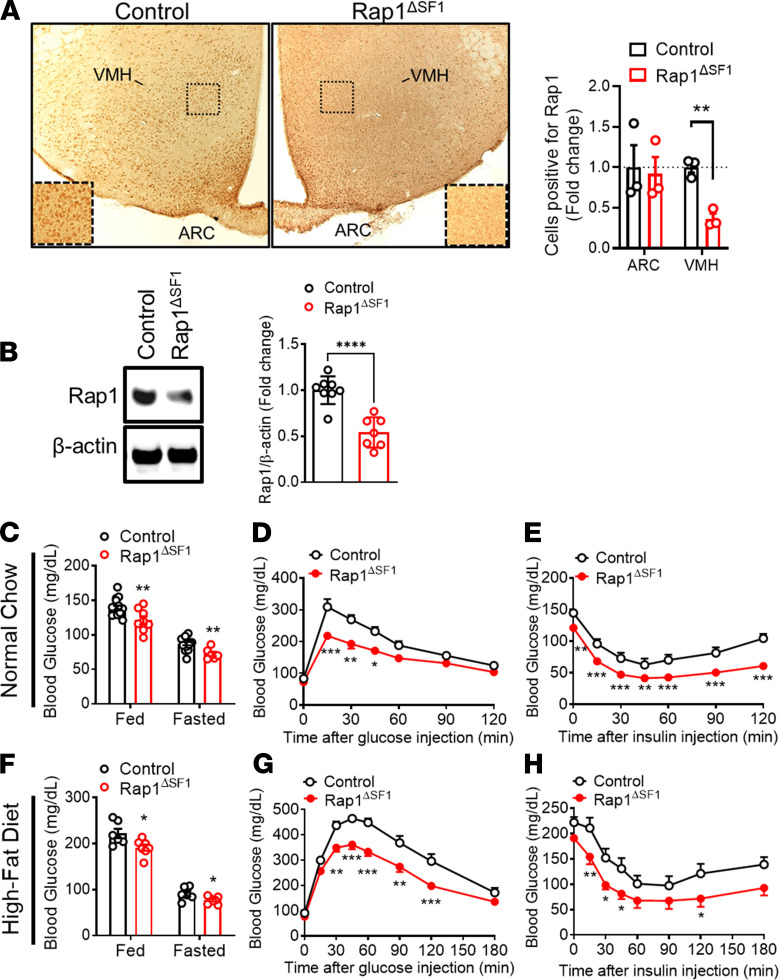
Figure 2. Improved glucose homeostasis in Rap1ΔSF1 mice.
(A) Representative images (original magnification, ×100; inset, original magnification, ×180) and quantification of Rap1 immunoreactivity in the hypothalamus of Rap1ΔSF1 mice and control mice. The number of Rap1-positive cells in the ARC and the VMH was counted and is represented as a fold change relative to control (n = 3). (B) Representative Western blots and densitometric quantification of VMH Rap1 expression normalized to β-actin. (n = 7–8/group). See complete unedited blots in the supplemental material. (C–E) Glucose profiles of Rap1ΔSF1 or control mice under normal chow conditions. Blood glucose (C, n = 6–15), glucose tolerance testing (D, n = 8), and insulin tolerance testing (E, n = 8) were measured. (F–H) Glucose profiles of HFD-fed Rap1ΔSF1 or control mice (14 weeks of HFD feeding, n = 6–7). Glucose (F), glucose tolerance testing (G), and insulin tolerance testing (H). *P < 0.05, **P < 0.01, ***P < 0.001, and ****P < 0.0001 for 2-tailed t tests (A–C and F) or 2-way ANOVA followed by Bonferroni’s multiple comparisons tests (D, E, G, and H). All error bars are mean ± SEM.

