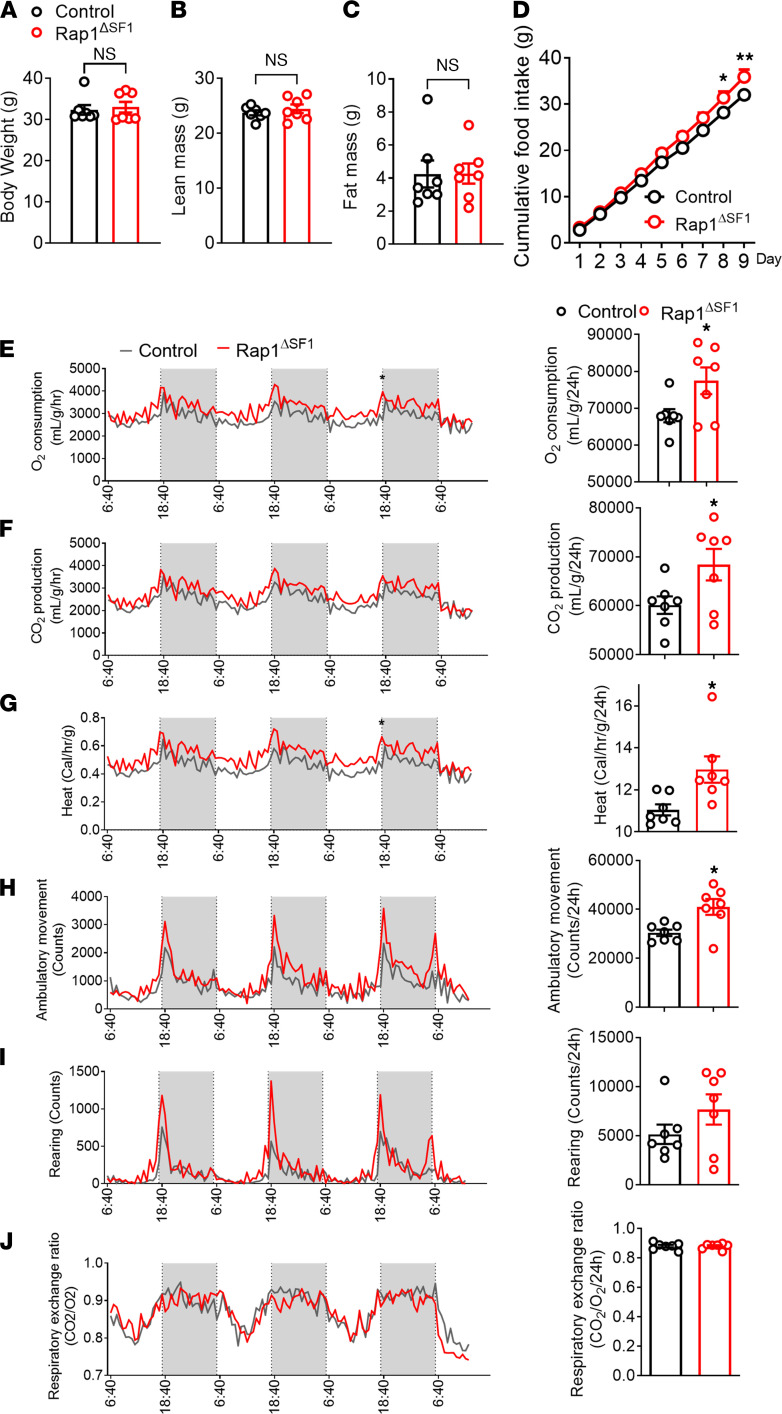
Figure 5. Food intake and energy expenditure of Rap1ΔSF1 mice.
Metabolic profiles of male Rap1ΔSF1 mice or control mice (n = 7 per group) with respect to body weight (A), lean mass (B), fat mass (C), food intake (D), O2 consumption (E), CO2 production (F), heat production (G), ambulatory activity (H), rearing (I), and respiratory exchange ratio (J). *P < 0.05 for 2-tailed t tests (A–C and E–J) or 2-way ANOVA followed by Bonferroni’s multiple comparisons tests (D). All error bars are mean ± SEM.

