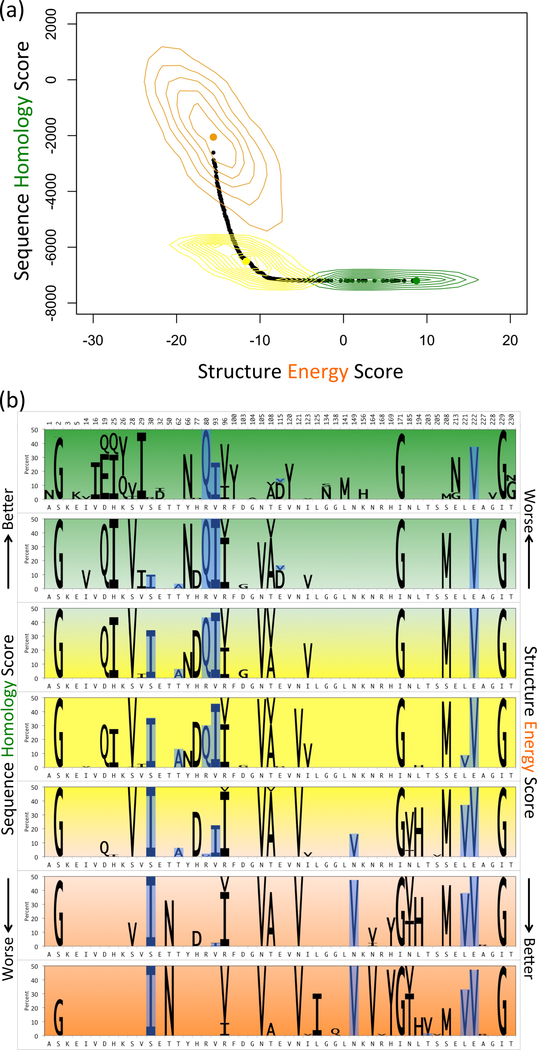
Fig. 3:
(a) Pareto frontier of 15-site point mutation GFP libraries. Selected library plans in sequence-optimized (green), structure-optimized (orange) and sequence-structure-optimized (yellow) regions are enumerated (random 1000 variants in each) and displayed as contours, (b) Amino acid composition of Pareto optimal 15-site point mutation GFP libraries. The seven panels represent different regions of the Pareto frontier, green for sequence-optimized, orange for structure-optimized and yellow for sequence-structure-optimized. The height of sequence logos corresponds to the abundance of mutations in the plans (wild-type not shown). Experimentally observed mutations are highlighted in blue.

