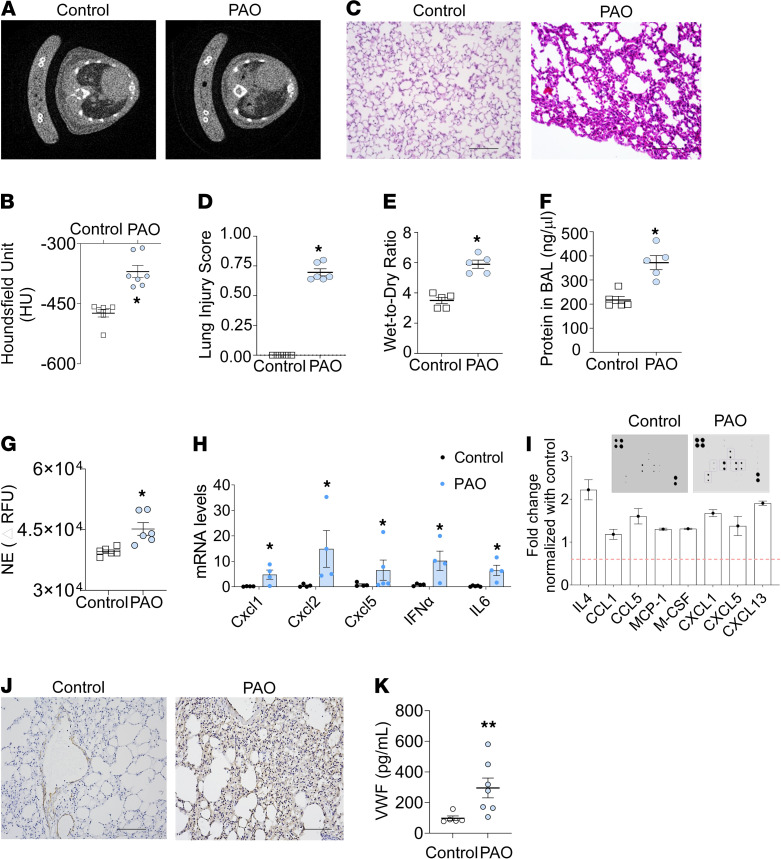
Figure 2. Single exposure of PAO on the skin results in ALI.
PAO (150 μg/mouse in 2 cm2 area) was applied to the skin of shaved C57BL/6J mice. These mice were sacrificed after 6 hours. (A) Micro-CT scan view at thoracic vertebrae shown in control and PAO group. (B) Micro-CT scan analysis for density of the lung (n = 7/group). (C) H&E staining images of lung sections (n = 5–6/group). Scale bar: 100 μm. (D) ALI score (control, n = 5 and PAO, n = 6). (E) Wet-to-dry weight ratio of mouse lungs (n = 5/group). (F) Protein levels in BAL fluid (n = 5/group). (G) Neutrophil elastase activity in BAL fluid (n = 5/group). (H) mRNA levels for inflammatory genes in BAL cell pellets (n = 4/group). (I) Cytokine protein array for acute inflammation in whole lung lysate of control and PAO groups. The selected cytokine levels are represented in the graph after normalization with the control group (n = 3 for each group). (J) Immunohistochemistry (IHC) for vWF in lung sections (n = 5/group). Scale bar: 100 μm. (K) Soluble vWF levels in serum (n = 5/group). Error bars are shown as the mean ± SEM. *P < 0.05, **P < 0.01. Statistics: 2-tailed t test. All experiments were repeated 3 times.

