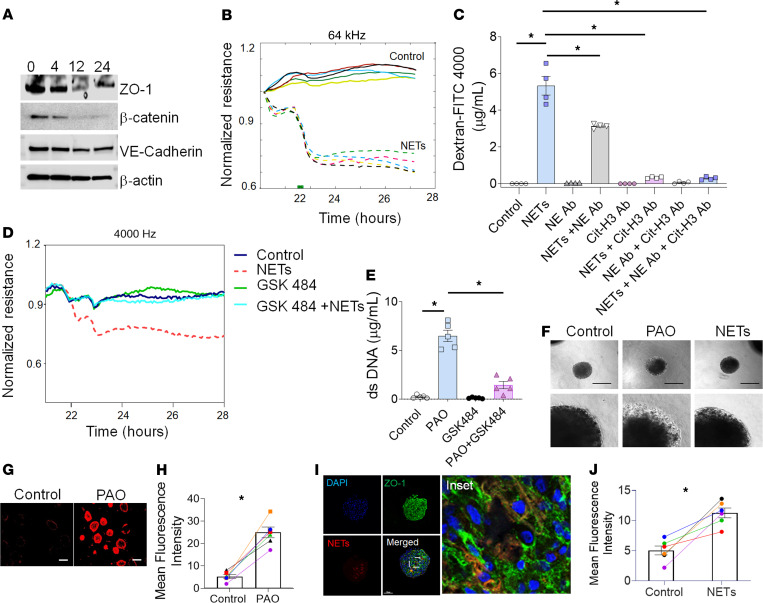
Figure 6. PAO-induced NETs disrupt barrier function in HLMVEC monolayers and spheroids.
(A) Representative immunoblot of ZO-1, VE-cadherin, and β-catenin after treatment with NETs isolated from human neutrophils after PAO treatment for indicated time points (n = 5). (B) Comparisons of normalized resistance of the HLMVEC monolayer upon stimulation with NETs. Each line represents NETs from an individual human subject. The stimulation time point is set as t = 0. (C) FITC-Dextran 4000 permeability assay. HLMVEC monolayers treated with vehicle (control), NETs, NE antibody, NE antibody and NETs, Cit-H3 antibody, Cit-H3 antibody and NETs, and Cit-H3 antibody, NE antibody, and NETs for 24 hours. (D) Representative data for comparisons of normalized resistance upon stimulation with NETs derived from controls (untreated), PAO, GSK484, and GSK484- and PAO-cotreated neutrophils in HLMVEC monolayers (n = 3 subjects). (E) Measurements of extracellular dsDNA levels in the supernatant of the control, PAO, GSK484, and GSK484- and PAO-cotreated neutrophils (n = 4). (F) Phase contrast images of spheroids treated with PAO or NETs (n = 3). Original magnification (lower panel), ×75. Images (G) and graph (H) for dextran permeability assay in primary HLMVEC spheroids. Scale bar: 200 μm. (I) Fluorescence images showing the expression of tight junction markers, ZO-1 (green), and extracellular dsDNA (NETs) (TOTO 3, red). Nuclei of spheroids were stained with Hoechst dye (blue). Scale bar: 100 μm. Inset showing magnified fluorescence image showing ZO-1 expression. Original magnification, ×15,000. (J) Dextran permeability assay in primary HLMVECs. All data are shown as the mean ± SEM. *P < 0.05. Statistics: 1-way ANOVA followed by Tukey’s multiple comparisons test (C and E) and Wilcoxon’s test (H and J).

