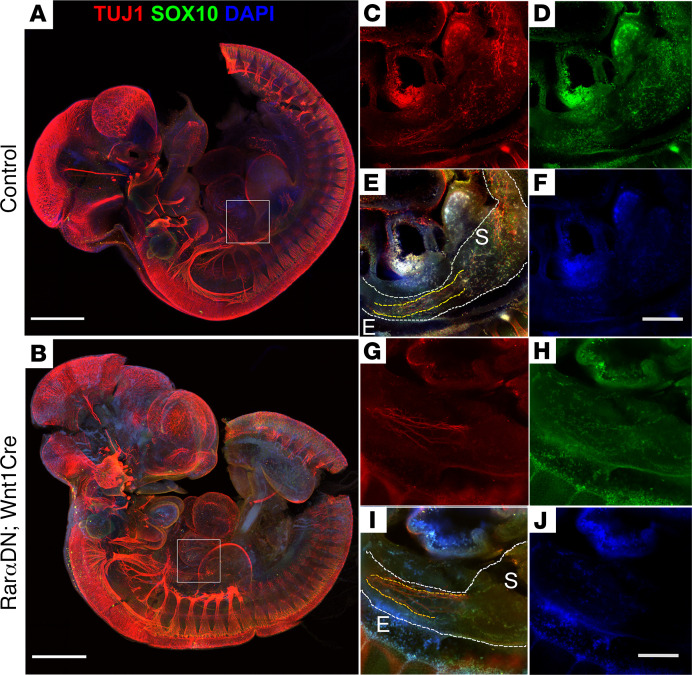
Figure 3. Blocking RAR signaling impairs ENCDC migration and differentiation at E10.5. (A and B) Whole embryo imaging showing E10.5 RarαDNLoxP/+ (control) (A) or E10.5 RarαDNLoxP/+; Wnt1Cre+ (B) mice stained with TUJ1 (red) and SOX10 (green) antibodies plus DAPI (blue).
Scale bar: 500 μm. (C–J) Zoomed-in images of selected slices from the Z-stack of the whole embryos show esophagus and stomach from control (C–F) or RarαDNLoxP/+; Wnt1Cre+ (G–J) mice. Scale bar: 100 μm. In control embryos, there are readily visible SOX10+TUJ1+ cells in both esophagus and stomach area (C–F). In contrast, there are almost no SOX10+ cells in the mutant stomach, even though SOX10+ cells were observed in the esophagus (G–J). (E and I) White dotted lines outline of esophagus and stomach. Yellow dotted lines highlight the region with extrinsic vagal nerve fibers. E, esophagus; S, stomach. These are representative images from n = 3 RarαDNLoxP/+ (control), n = 3 RarαDNLoxP/+; Wnt1Cre+.

