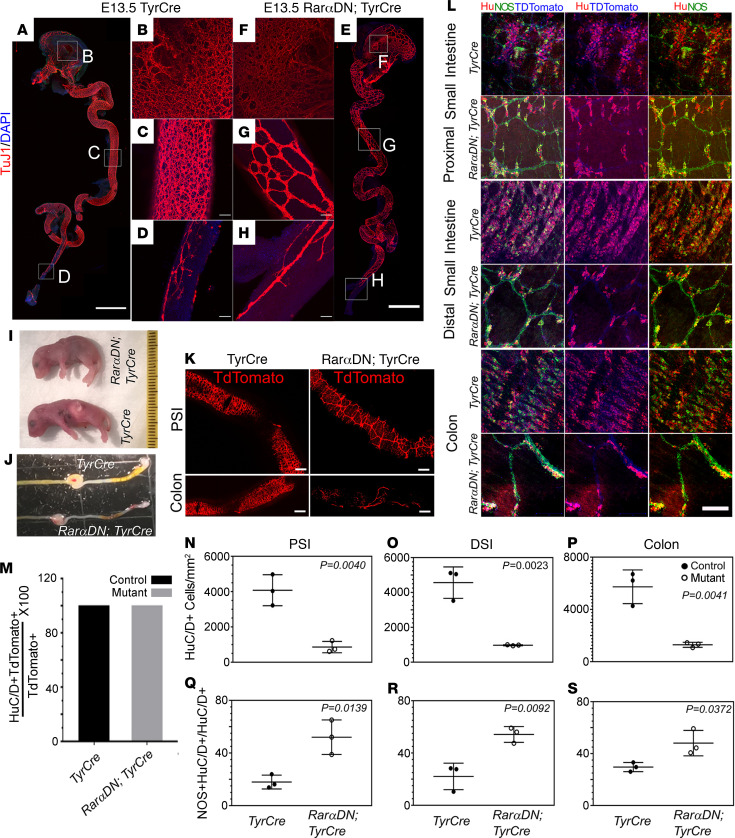
Figure 8. TyrCre-driven RarαDN reduces enteric neuron number and causes abnormal ENS patterning.
(A–H) E13.5 RarαDNLoxP/+; TyrCre+ or TyrCre+ (control) bowels stained with TuJ1 antibody (red) and DAPI. Scale bars: 1 mm (A and E). Boxes in A and E indicate regions of stomach (B and F), midgut (C and G), and distal colon (D and H) that are magnified in adjacent images. Scale bars: 50 μm (B–H). (I) RarαDNLoxP/+; TyrCre+ appear similar to control (TyrCre+) at birth but did not feed and lack a milk spot in stomach (n = 6). (J) RarαDNLoxP/+; TyrCre+ distal bowel appeared grossly similar to control (TyrCre+) at P0 (n = 10). (K) TdTomato+ images of proximal small intestine (PSI) and colon of either RarαDNLoxP/+; TyrCre+ or TyrCre+ (control) E18.5 pups. Scale bar: 1 mm. (L) Whole-mount IHC of E18.5 RarαDNLoxP/+; TyrCre+ or TyrCre+ (control) bowels using HuC/D (red) and NOS1 (green) antibodies and via TdTomato (blue) fluorescence. Scale bar: 100 μm. (M) All TdTomato+ cells in the small bowel and colon were HuC/D+ in E18.5 RarαDNLoxP/+; TyrCre+ and TyrCre+ (control) mice. (N–S) Total HuC/D+ neurons were reduced in PSI, distal small intestine (DSI) and colon of RarαDNLoxP/+; TyrCre+ mice (N–P), but the percentage of HuC/D+ neurons expressing NOS1 was increased in mutants (Q–S). n = 3, TyrCre+ (control); n = 3, RarαDNLoxP/+; TyrCre+. Two-tailed unpaired Student’s t tests were used for statistics.

