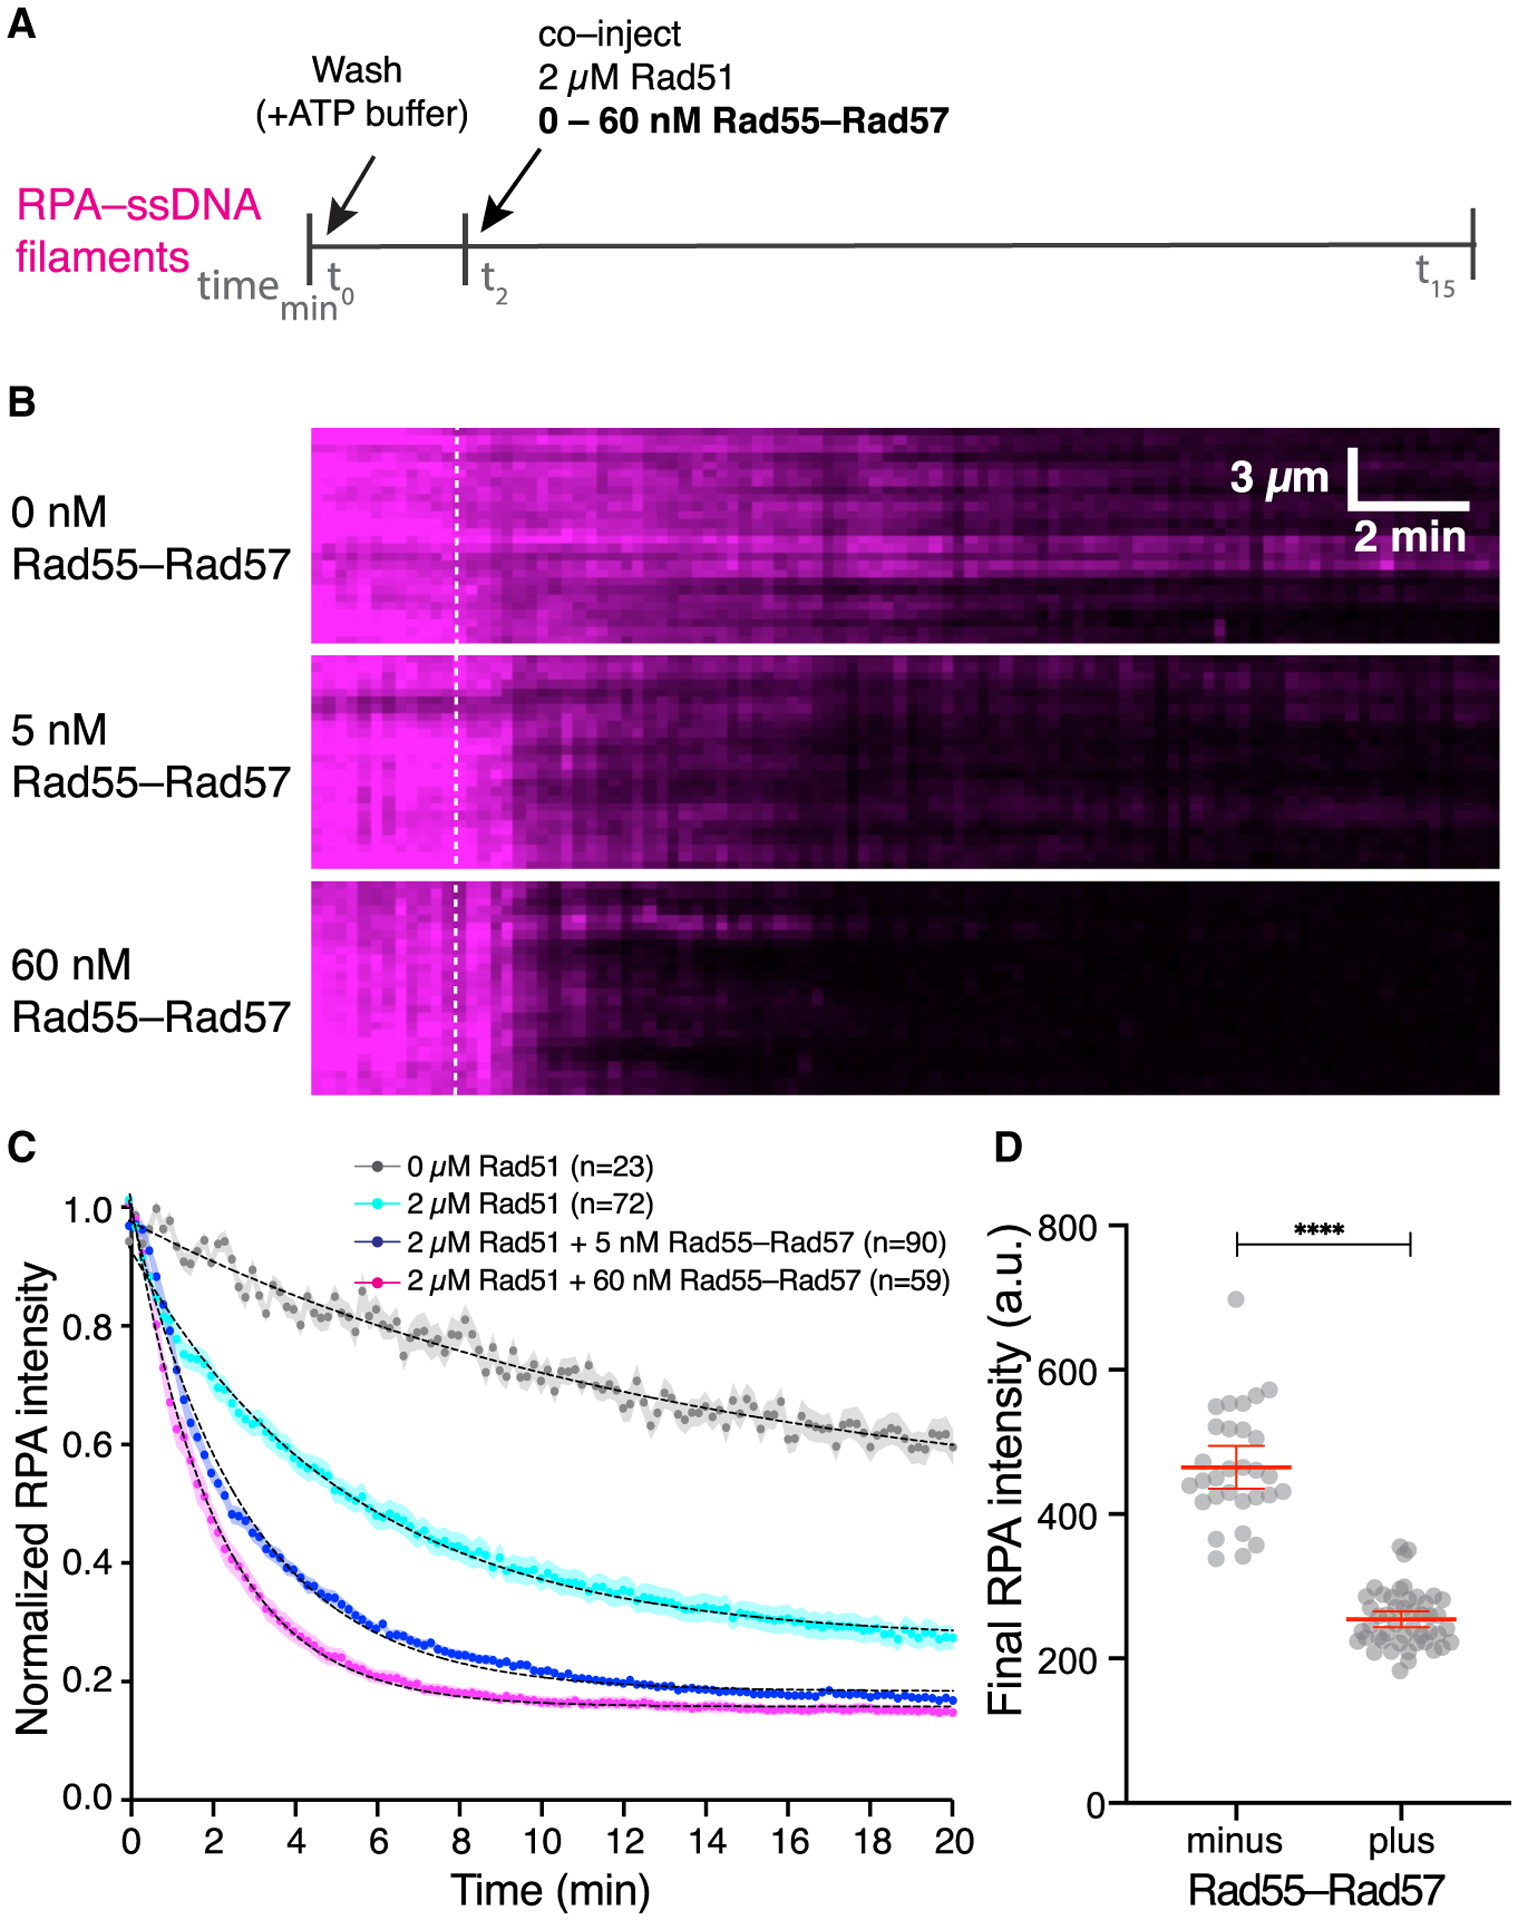
Figure 3. Rad55-Rad57 stimulates Rad51 filament assembly and promotes depletion of RPA.

(A) Schematic of the experimental setup.
(B) Kymographs of representative DNA molecules showing loss of RPA-mCherry after Rad51 injection with 0, 5, or 60 nM GFP-Rad55-Rad57. Time of injection is indicated by a white dashed line.
(C) Quantification of the experiment depicted in (A) and (B), showing the kinetics of RPA-mCherry loss under the indicated conditions. Data are represented as mean normalized RPA intensity; the shaded area represents 95% CI. Data were derived from two or more flow cells per reaction condition. Single exponential decay fits are depicted by a black dotted line. Signal loss in the 0 μM Rad51 experiment represents photobleaching of RPA-mCherry.
(D) RPA-mCherry signal remaining on the ssDNA molecules after Rad51 assembly plateaued, without (n = 30) or with 5 nM Rad55-Rad57 (n = 48). Red bars indicate mean ± 95% CI. Data were derived from two flow cells per reaction condition.
