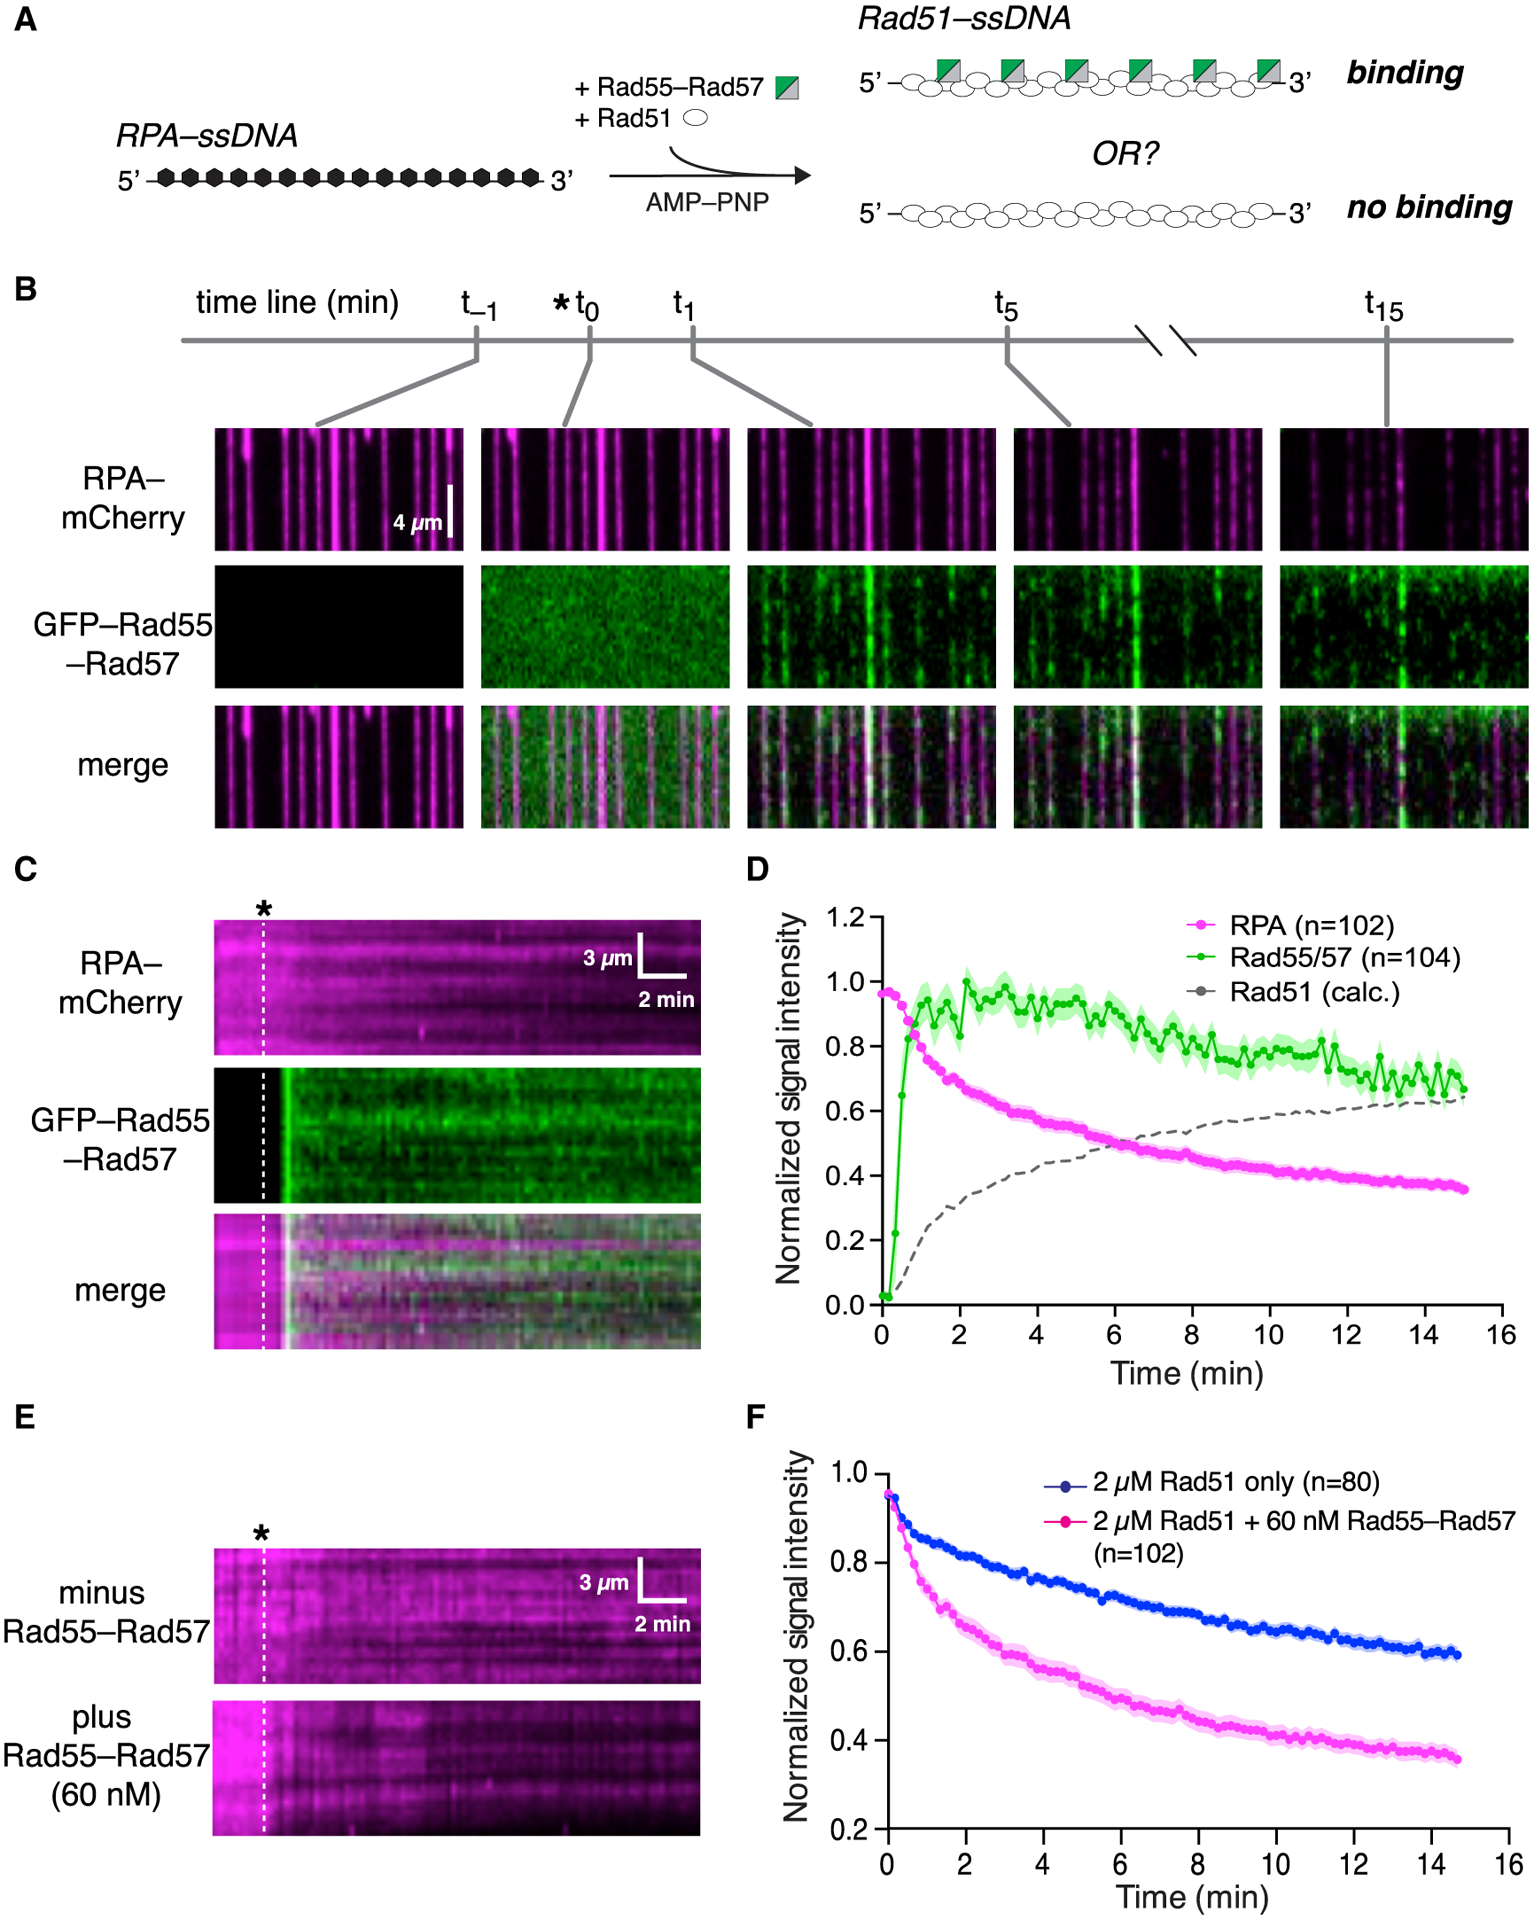
Figure 4. ATP hydrolysis by Rad55-Rad57 is required for its release from Rad51-ssDNA filaments.

(A) Experimental schematic.
(B) Wide-field views of RPA-mCherry (magenta)-bound ssDNA at the indicated time points. Rad51 and Rad55-Rad57 (green) were injected with 2 mM AMP-PNP.
(C) Representative kymographs showing loss of mCherry-RPA and retention of GFP-Rad55-Rad57. Time of injection is indicated by a white dashed line.
(D) Mean normalized RPA-mCherry and GFP-Rad55-Rad57 intensity; the shaded area represents 95% CI. Data were derived using three flow cells per reaction condition. Rad51 assembly kinetics are plotted as [1 – RPA] signal for comparison.
(E) Representative kymographs showing RPA-mCherry loss at the indicated concentrations of Rad55-Rad57 co-injected with 2 μM Rad51 in AMP-PNP. Time of injection is indicated by a white dashed line.
(F) Quantification of the experiment described in (E), showing kinetics of RPA-mCherry loss under the indicated conditions. Data are represented as mean normalized intensity; the shaded area represents 95% CI. Data were derived using three flow cells per reaction condition.
See also Figures S4 and S5.
