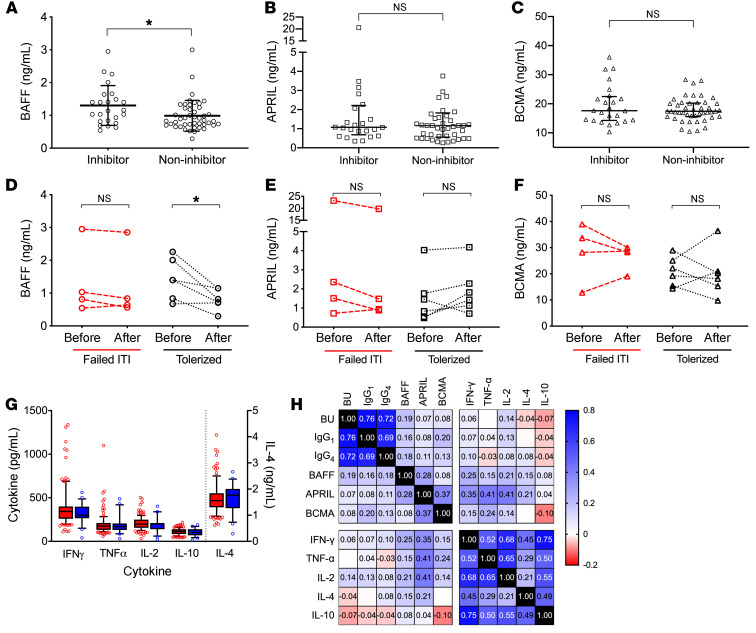
Figure 1. B cell cytokine levels in pediatric patients with hemophilia A.
B cell cytokines in pediatric HA patients with FVIII inhibitors (n = 24) or without FVIII inhibitors (n = 45). (A) BAFF levels. (B) APRIL levels. (C) BCMA levels via unpaired t test. Longitudinal analysis of (D) BAFF, (E) APRIL, and (F) BCMA levels in pediatric patients with inhibitors who failed immune tolerance induction (n = 4) or succeeded (n = 6) via paired t test. (G) Peripheral T-helper cytokine levels in pediatric HA patients with (red squares) and without (blue squares) inhibitors via unpaired t test. (H) Heatmap of Spearman’s correlation of Bethesda titer, α-FVIII IgG subclasses, and cytokines. Box-and-whisker plots show median with 25%–75% IQR, whiskers delineate 10th and 90th percentiles, with values outside these ranges shown as symbols. Other data plotted as mean ± SD. *P < 0.05. NS, not significant.

