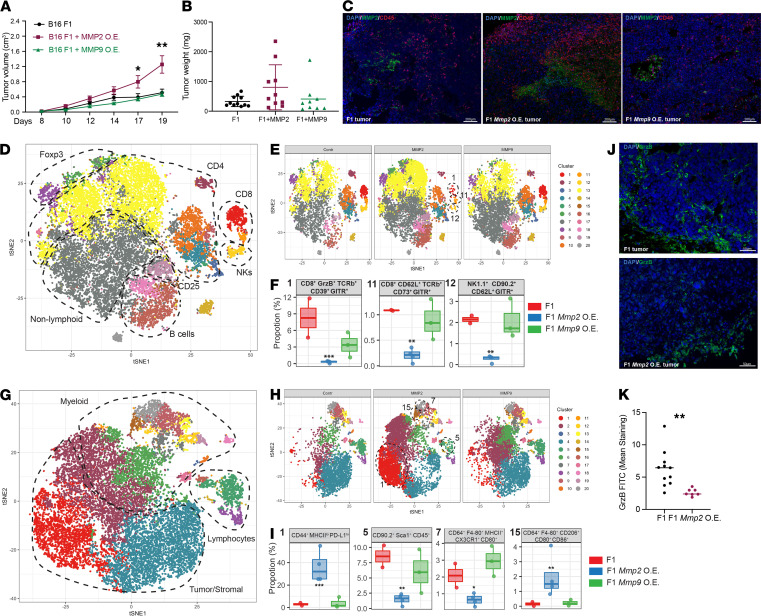
Figure 4. Mmp2 overexpression in B16 cells promotes melanoma tumor growth.
Mmp2 and Mmp9 were OE in B16 F1 cells and injected into mice. (A and B) Tumor kinetics was measured up to 20 days. Tumor volume (A) and weight (B) are displayed. n = 8–10 mice per group. Data are representative of 5 independent experiments with mean ± SEM. *P < 0.05 and **P < 0.01. Two-way ANOVA with Dunnett’s post hoc test. (C) Immunofluorescence (IF) staining for MMP2 (green), CD45 (red), and DAPI (blue). Scale bars: 200 μm. (D–F) CyTOF analysis of lymphoid panel. viSNE plot of immune, stromal, and tumor cell clusters present in the tumors at day 19 (D) identified with aid of single marker expression in all samples. Population comparison between F1 and F1 Mmp-OE tumors (E) were identified, and clusters differentially expressed between the different groups of tumors were identified (F). (G–I) CyTOF analysis of Myeloid panel. viSNE plot of immune, stromal, and tumor cell clusters present in the tumors at day 19 (G) identified with aid of single marker expression in all samples. Population comparison between F1 and F1 MMP-OE tumors (H) were identified, and clusters differentially expressed between the different groups of tumors were identified (I). Data are representative of 2–4 mice with mean ± SEM. *P < 0.05, **P < 0.01, and ***P < 0.001. P values were adjusted using FDR. Statistical analysis was performed using binomial generalized linear mixed-effects model (GLMM). (J) IF of granzyme-B (green) and DAPI (blue) in F1 tumors (top) and F1 Mmp2-OE tumors (bottom). Scale bars: 50 μm. (K) Quantification of GrzB staining. n = 8–12 sections with mean ± SEM. **P < 0.01. Student’s t test.

