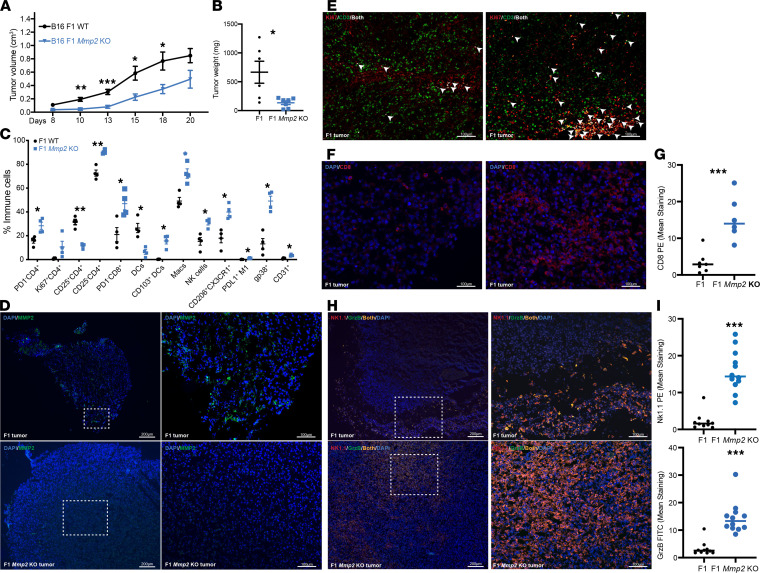
Figure 5. Mmp2 depletion in B16 cells impairs melanoma tumor growth.
The levels of Mmp2 in the B16 was modulated by CRISPR KO systems. In total, 3 × 10⁵ B16 F1 or F1 Mmp2-KO cells and tumors were measured up to 20 days. (A and B) Tumor volume (A) and weight (B) are displayed. Data are representative of 5 independent experiments with mean ± SEM. n = 8–10 mice per group. *P < 0.05, **P < 0.01, and ***P < 0.001. Multiple t tests with Holm-Sidak correction for multiple comparisons. (C) FACS analysis on day 19 shows changes in hematopoietic cell infiltration. Data are representative of 3 independent experiments with mean ± SEM. n = 4 mice per group. *P < 0.05 and **P < 0.01. Multiple t tests with Holm-Sidak correction for multiple comparisons. (D–I) Immunofluorescence (IF) stainings. (D) IF staining for MMP2 (green) and DAPI (blue). F1 control tumors on the top panel and F1 Mmp2-KO controls on the bottom panel. Scale bars: 200 μm on left panels and 100 μm on right panels. (E) IF colocalization (white) of CD3+ T cells (green) with Ki67 (red) in Mmp2-KO tumors. Colocalization is shown is white arrowheads. Scale bars: 100 μm. (F) IF staining of CD8 (red) and DAPI (blue). Scale bars: 100 μm. (G) Quantification of the CD8 staining. Data representative of 2 experiments. n = 6. mean ± SEM. ***P < 0.001. Student’s t test. (H) IF staining of NK1.1 (red), granzyme B (green), and DAPI (blue) infiltrates in the tumor bed. F1 tumors on top panels and F1 Mmp2-KO tumors on the bottom panels. Scale bars: 200 μm on left panels and 100 μm on right panels. Colocalization is shown in orange. (I) Quantification of NK1.1 and granzyme-B staining. Data are representative of 2 experiments. n = 6. mean± SEM. ***P < 0.001. Student’s t test.

