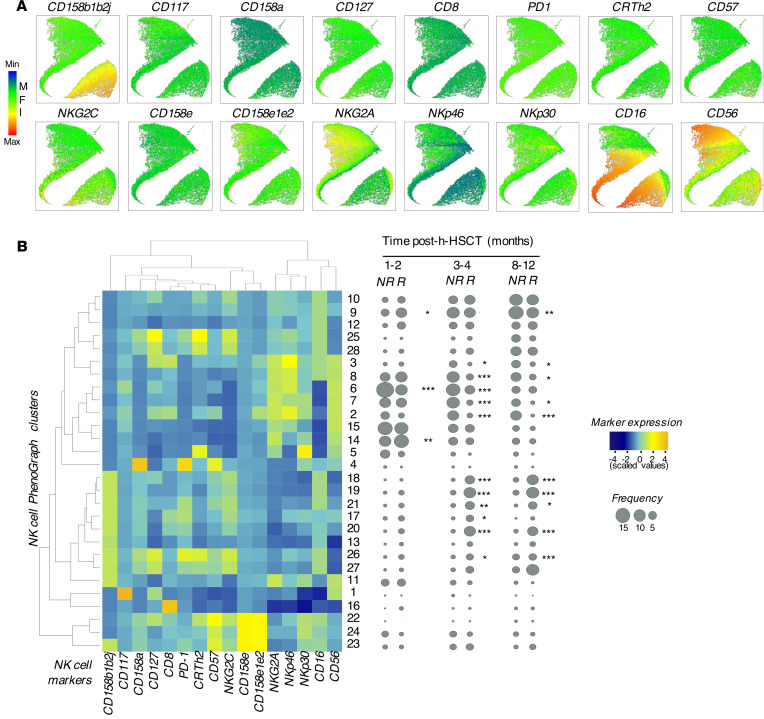
Figure 2. High-dimensional single-cell analysis of NK cell phenotype in h-HSCT recipients.
(A) UMAP plots showing the mean fluorescence intensity (MFI) of markers on concatenated NK cells (2,000 cells/sample) from both NR and R recipients at different time points after h-HSCT. (B) Heatmap showing the expression as a percentage of NK cell markers (columns) on the 28 clusters (rows) assessed by PhenoGraph from h-HSCT recipients regardless of HCMV reactivation/infection (left). Statistical balloon plots showing the median frequencies of each PhenoGraph NK cell cluster in R (n = 13) and NR (n = 6) recipients at three different time points (1–2, 3–4, and 8–12 months) after h-HSCT (right). Multiple t tests, NR versus R recipients. *P < 0.05, **P < 0.01, ***P < 0.001.

