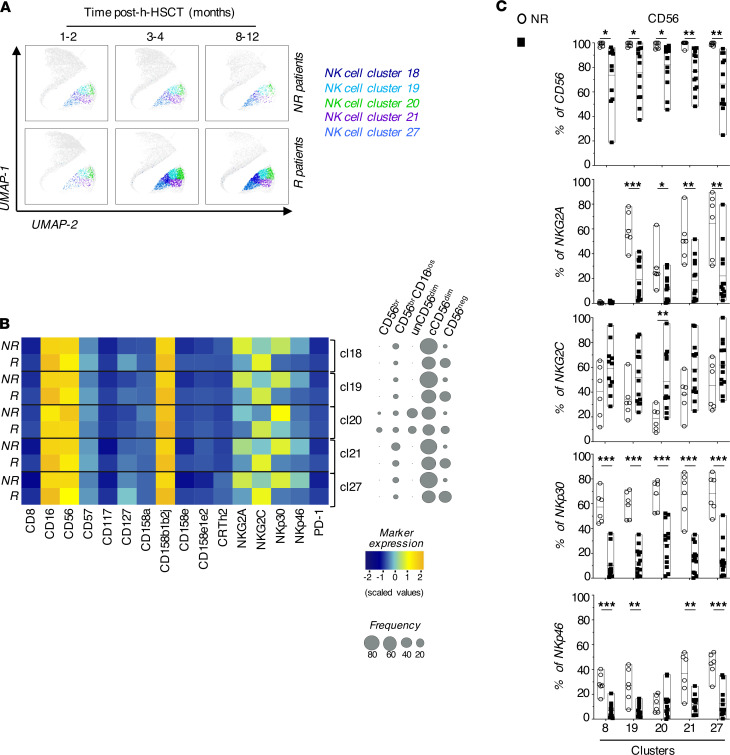
Figure 3. HCMV shapes the NK cell receptor repertoire in patients who underwent h-HSCT.
(A) UMAP plots depicting the distribution of 18, 19, 20, 21, and 27 clusters in NR (upper panels) and R (lower panels) recipients before (1–2 months), soon (3–4 months), and late (8–12 months) after HCMV infection/reactivation. NK cell clusters are overlaid with the total NK cell distribution (gray background). (B) Heatmap showing the expression of NK cell markers and receptors on clusters 18, 19, 20, 21, and 27 in NR (n = 6) and in R (n = 13) h-HSCT recipients (left). Balloon plots showing the distribution of NK cell subsets in each of the 5 clusters in NR and R recipients at 8–12 months after h-HSCT (right). (C) Summary statistical graphs reporting the frequencies (%) of NK cell markers differentially expressed in clusters 18, 19, 20, 21, and 27 in NR (n = 6) and R (n = 13) recipients at 8–12 months after h-HSCT. Unpaired t test. *P < 0.05, **P < 0.01, ***P < 0.001.

