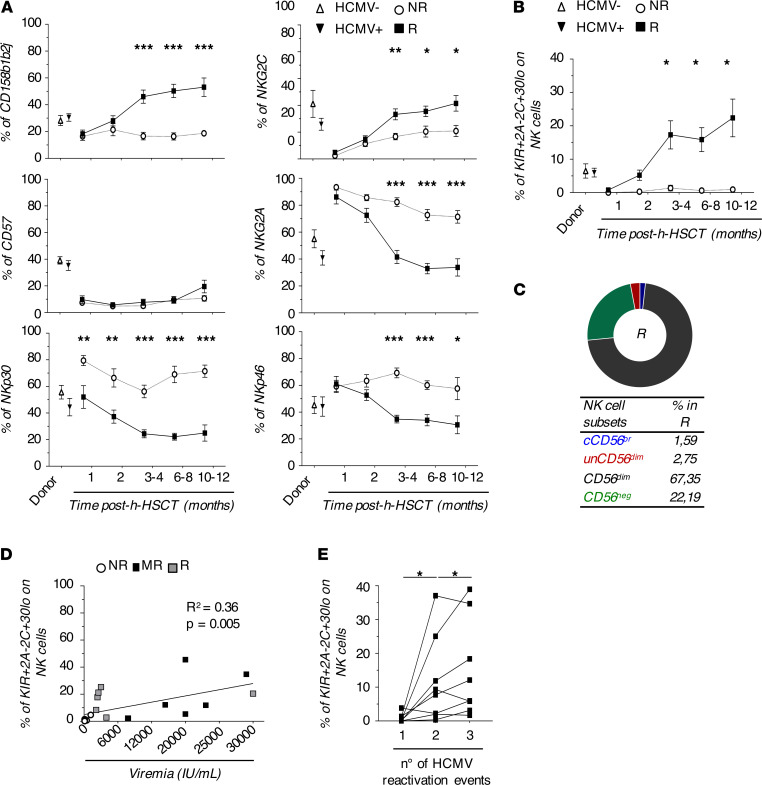
Figure 4. Expansion of long-lasting CD158b1b2jpos/NKG2Aneg/NKG2Cpos/NKp30lo NK cell in response to HCMV infection/reactivation.
(A) Summary statistical graphs showing the frequency (%; mean ± SEM) of NK cell receptors differentially expressed in NK cell clusters 18, 19, 20, 21, and 27 in HCMV- (n = 6) and HCMV+ (n = 11) donor PBMCs and in NR (n = 14) and in R (n = 18) patients who underwent h-HSCT at different time points after the transplant. Unpaired t test. (B) Summary statistical graph showing the frequency (%, mean ± SEM) of CD158b1b2jpos/NKG2Aneg/NKG2Cpos/NKp30lo NK cells on total NK cells in HCMV- (n = 6) and HCMV+ (n = 11) donor PBMCs and NR (n = 14) and R (n = 18) recipients at different time points after h-HSCT. (C) Pie chart showing the relative frequencies of NK cell subsets within the CD158b1b2jposNKG2AnegNKG2CposNKp30lo NK cell population of R (n = 18) recipients at 8–12 months after h-HSCT. (D) Summary statistical graph showing the correlation between the frequency (%) of CD158b1b2jpos/NKG2Aneg/NKG2Cpos/NKp30lo NK subset on total NK cells and HCMV pick of viremia (IU/mL) in R either experiencing single (R, n = 5) or multiple (MR, n = 6) HCMV reactivations at 8–12 months after h-HSCT. Data from NR patients (n = 8) at 8–12 months after h-HSCT are inserted as negative control. (E) Summary statistical graphs showing the frequency (%) of CD158b1b2jpos/NKG2Aneg/NKG2Cpos/NKp30lo on total NK cells in MR patients (n = 7) experiencing 3 longitudinal reactivation events (n° = 1, 2, and 3). Blood samples of MR were analyzed at the first available time point (range: 0–21 days) after the pick of viremia defining HCMV reactivation events. Paired t test. *P < 0.05, **P < 0.01, ***P < 0.001.

