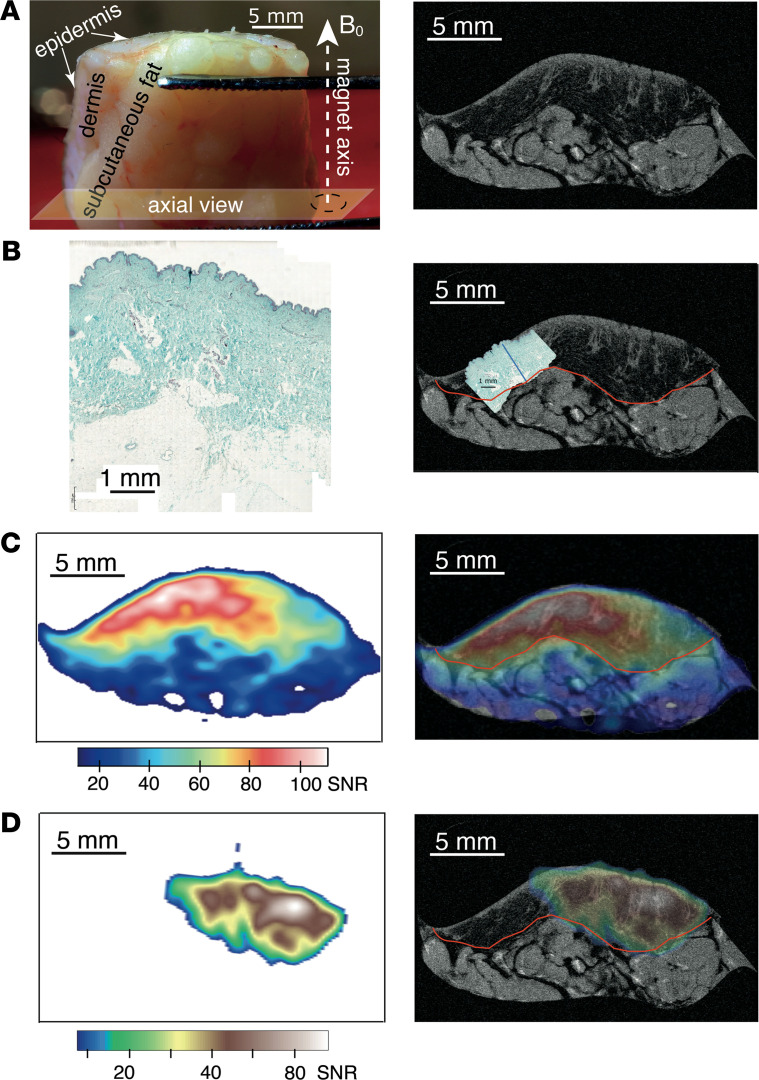
Figure 3. Illustration of 23Na MRI biopsy.
(A) Photograph of a typical skin sample with indication of MRI axial view, left, and a high-resolution 1H MRI slice (11 × 11 × 100 μm3, axial view) showing the anatomy of the DB9 skin sample (right). (B) Histological GAG staining of typical skin specimen (i.e., harvested from NDB8) (left) and histology slice scaled to match the scale of the 1H MRI slice of DB9 to demonstrate that GAGs are localized predominantly in the dermis layer (right). The boundary of the dermis layer is indicated with red line, while blue line reflects the depth of GAG staining determined from histology. (C) Localization of free sodium in DB9 obtained through 23Na MRI (left) and its overlay with skin anatomical 1H MRI slice of DB9 (right). (D) Localization of bound sodium in DB9 obtained through TQF 23Na MRI (left) and its overlay with skin anatomical 1H MRI slice of DB9 (right). Note that free and bound sodium coregister predominantly with the dermis layer where GAGs are located. Sodium concentrations are expressed through the observed 23Na signal/noise ratios (SNRs).

