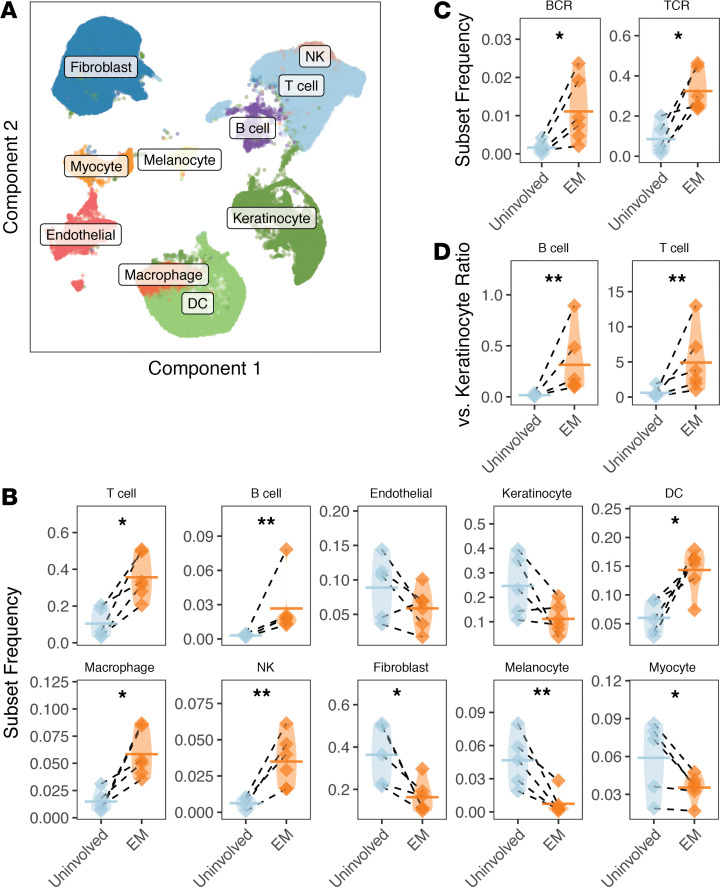
Figure 2. B cells and T cells infiltrate EM lesions.
(A) UMAP projection of single-cell gene expression data from both EM and uninvolved samples from subjects in cohort 1 with clusters annotated based on marker genes. (B) The fraction of cells found in each cluster per subject as a fraction of total cells from the sample for all 10 cell subsets (as annotated by marker genes). (C) Frequency of cells associated with a reconstructed IGH and associated IGK/L (“BCR”) or TCRB (“TCR”) receptor from repertoire sequencing as a fraction of total cells in the sample. (D) Ratio of B cells and T cells relative to keratinocytes in EM lesions compared with uninvolved samples based on frequencies computed from data in B. Horizontal bars show the mean frequency of each comparison and frequencies belonging to the same subject are connected with dashed lines. Data for the same n = 6 subjects from cohort 1 are shown for all panels. Statistical differences are shown only when significant for a paired ratio t test (**P < 0.01; *P < 0.05). EM, erythema migrans; BCR, B cell receptor; TCR, T cell receptor.

