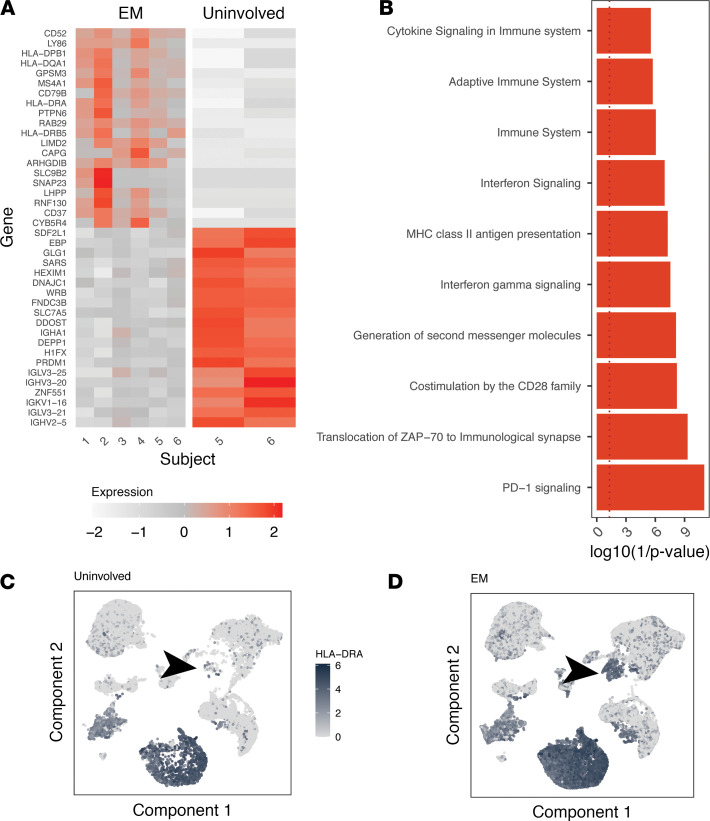
Figure 3. B cells in EM lesions express high levels of MHC class II genes and signatures of IFN gene signaling and antigen presentation.
(A) Heatmap of top 20 and bottom 20 DEGs for B cells from EM compared with B cells from uninvolved skin based on absolute average minimum gene expression difference (see Methods). (B) enrichR gene ontology analysis of the top 40 genes upregulated in B cells from EM tissue. Red bars correspond to the top significantly associated gene ontology assignments (P < 0.05 by Wilcoxon’s test). Gene expression of the “HLA-DRA” MHCII gene displayed over a UMAP projection of all single-cell gene expression data from the 6 subjects with the intensity of shading correlated with the normalized expression in either uninvolved (C) or EM skin (D). The arrow points to the location of the B cell single-gene expression cluster. Data for the same n = 6 subjects from cohort 1 are shown for all panels. EM, erythema migrans; DEGs, differentially expressed genes.

