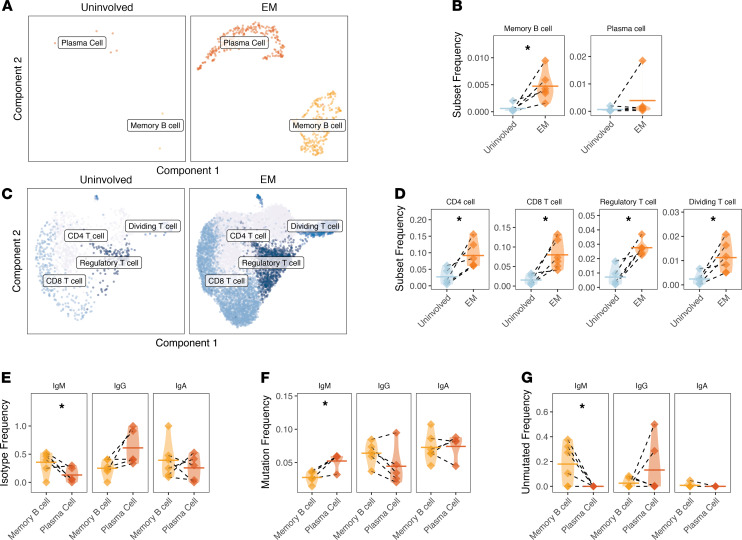
Figure 4. Memory B cells and all T cell subsets are more abundant in EM skin; memory B cells have distinct characteristics compared with plasma cells.
(A) UMAP projection of B cell subsets from uninvolved or EM skin. Cells include those assigned to the B cell cluster with an associated BCR from repertoire sequencing. (B) Frequency of cells from the 2 B cell clusters reported as a frequency of total cells, with significance shown for a ratio t test. One subject had a high plasma cell frequency (1.9%) largely due to the presence of an expanded clone; (C) UMAP projection of T cell subsets from either uninvolved or EM skin. Cells include those assigned to the T cell cluster with an associated TCRB receptor from repertoire sequencing. (D) Frequency of cells from the 4 T cell clusters as a frequency of total cells from each subject sample from either uninvolved or EM skin with significance shown as a ratio t test. (E) Average distribution of isotypes among members of the 2 EM B cell clusters, expressed as a fraction of total cells from the subset. (F) Average SHM frequency of 2 EM B cell clusters based on isotype. (G) Overall frequency of unmutated VH gene segments among members of the 2 B cell cluster by isotype, expressed as a fraction of the subset with a given isotype. Horizontal bars show the mean frequency of each comparison and frequencies belonging to the same subject are connected with dashed lines. Data for the same n = 6 subjects from cohort 1 are shown for all panels. Statistical differences are shown only when significant for a paired (ratio) t test (*P < 0.05). EM, erythema migrans; BCR, B cell receptor.

