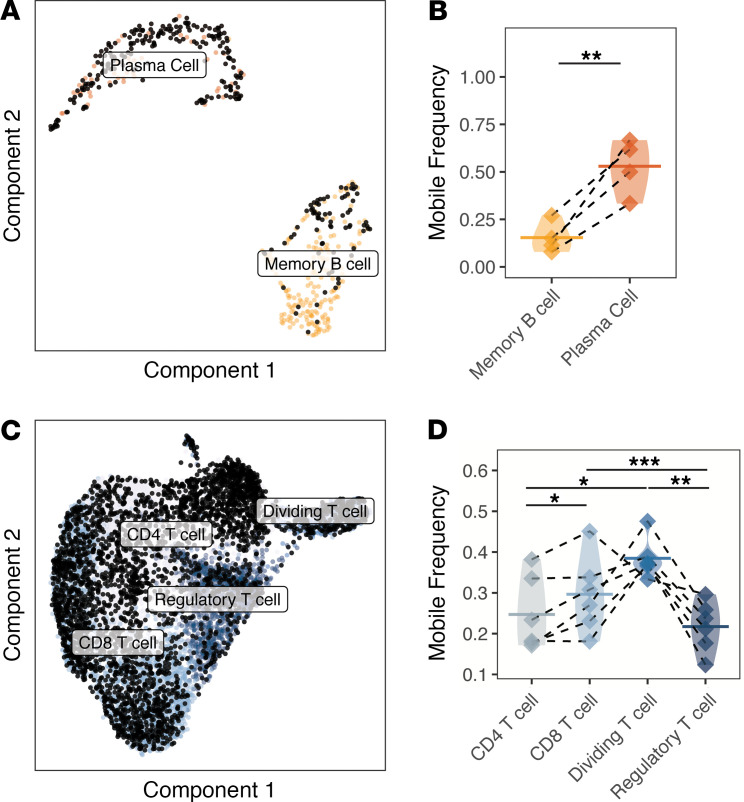
Figure 5. B cell and T cell clones from the EM lesions can be traced to the circulation.
(A) UMAP projection of the B cell subset overlaid with black dots denoting B cells clonally related to those present in the circulation identified by bulk IGH repertoire sequencing (unpaired). (B) The frequency of each B cell subset clonally related to those present in the circulation is designated as “mobile.” Samples with fewer than 6 B cells (paired with BCR receptors) were excluded from analysis. (C) UMAP projection of the T cell subset overlaid with black dots denoting T cells that are clonally related to those present in the circulation from bulk TCRB repertoire sequencing (unpaired). (D) Frequency of each T cell subset clonally related to those present in the circulation designated as mobile. Skin samples with fewer than 6 T cells were excluded from analysis. Values are quantified as a fraction of the clones from each subset. Horizontal bars show the mean frequency of each comparison and frequencies belonging to the same subject are connected with dashed lines. Data for the same n = 6 subjects from cohort 1 are shown for all panels except for B, which only shows n = 4 subjects with B cells that could be traced to the circulation. Statistical differences are shown only when significant for a paired t test (***P < 0.001; **P < 0.01; *P < 0.05). EM, erythema migrans; BCR, B cell receptor.

