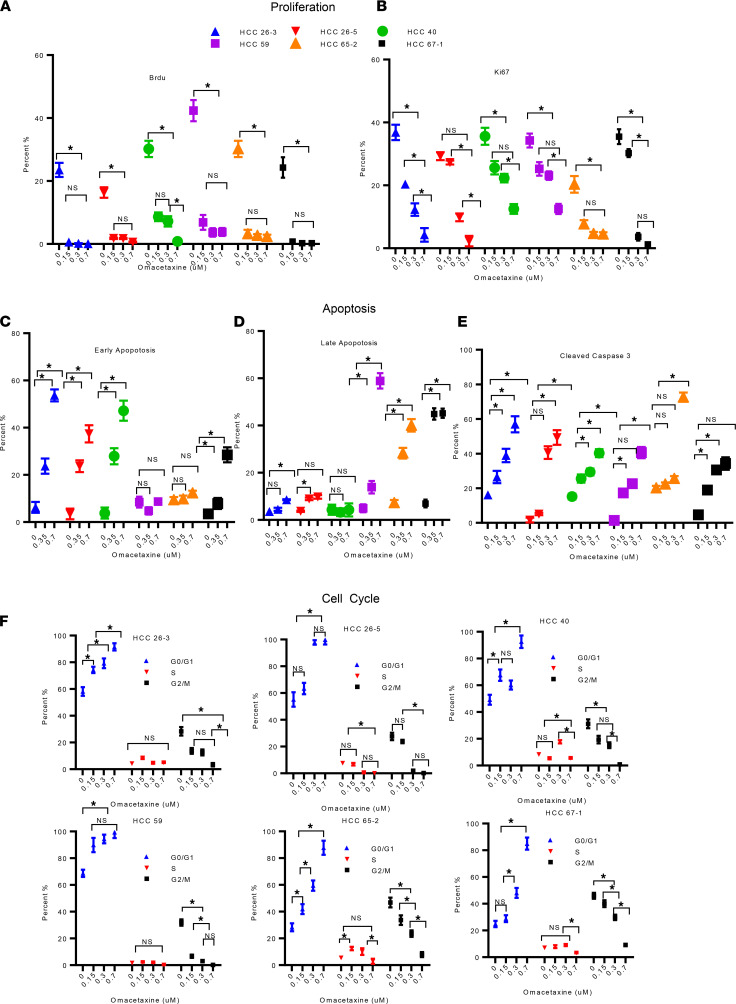
Figure 3. Omacetaxine impacts proliferation, apoptosis, and cell cycle.
Six HCC PDO lines were treated with omacetaxine at various concentrations (negative control: 0 μM, 0.15 μM, 0.30 μM, and 0.7 μM). (A) BrdU incorporation demonstrates statistically significantly lower proliferation with omacetaxine in each of the 6 human HCC PDO lines tested. Primary FACS data are shown in Supplemental Figure 2. (B) Ki-67 staining verifies decreasing proliferation with omacetaxine treatment in each of the 6 human HCC PDO lines. Primary FACS data are shown in Supplemental Figure 3. (C and D) Annexin V/7AAD staining (C). Bar graphs display the effects of omacetaxine on early apoptosis (C) and late apoptosis (D). Primary FACS data are shown in Supplemental Figure 4. (E) Flow cytometry analysis of cleaved caspase 3 expression. Primary FACS data are shown in Supplemental Figure 5. (F) Effects of omacetaxine on cell cycle. Histograms of PI staining are shown in Supplemental Figure 6. Data are shown as the mean ± SEM from 3 independent experiments. Two-tailed Student’s t test was used for all the statistical analysis. *P < 0.01.

