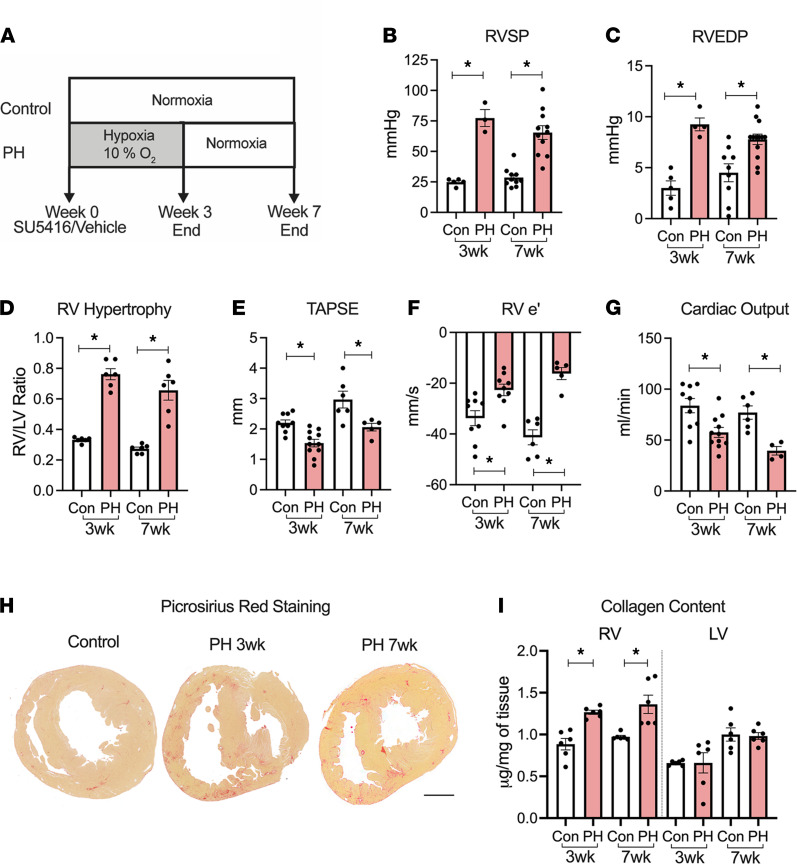
Figure 1. Characterization of pulmonary hypertension model.
(A) Schematic of the experimental design. (B and C) Invasively measured RVSP (B) and RVEDP (C) at 3 weeks (wks) (n = 5 control/3 PH) and 7 wks (n = 10/11). (D) RV weight normalized to the respective LV weight (n = 6/6). (E–G) Echocardiographic measurements at 3-wk (n = 9/11) and 7-wk (n = 6/5) time points of TAPSE (E) using M-Mode, RV free wall early diastolic velocity (e’) using tissue Doppler (F), and cardiac output (G). (H) Representative images of transverse heart sections from control and PH animals stained with Picrosirius red. Scale bar: 5 mm. (I) Collagen content measured using hydroxyproline assay from RV and LV homogenates at 3 wks (n = 6) and 7 wks (n = 6). Two-tailed t tests were performed between control and PH at 3wks and 7 wks; *P < 0.05. Con, control; PH, pulmonary hypertension; RV, right ventricle; RVEDP, right ventricular end diastolic pressure; RVSP, right ventricular systolic pressure; RV e’, right ventricle free wall early diastolic velocity (e’); TAPSE, tricuspid annular plane systolic excursion.

