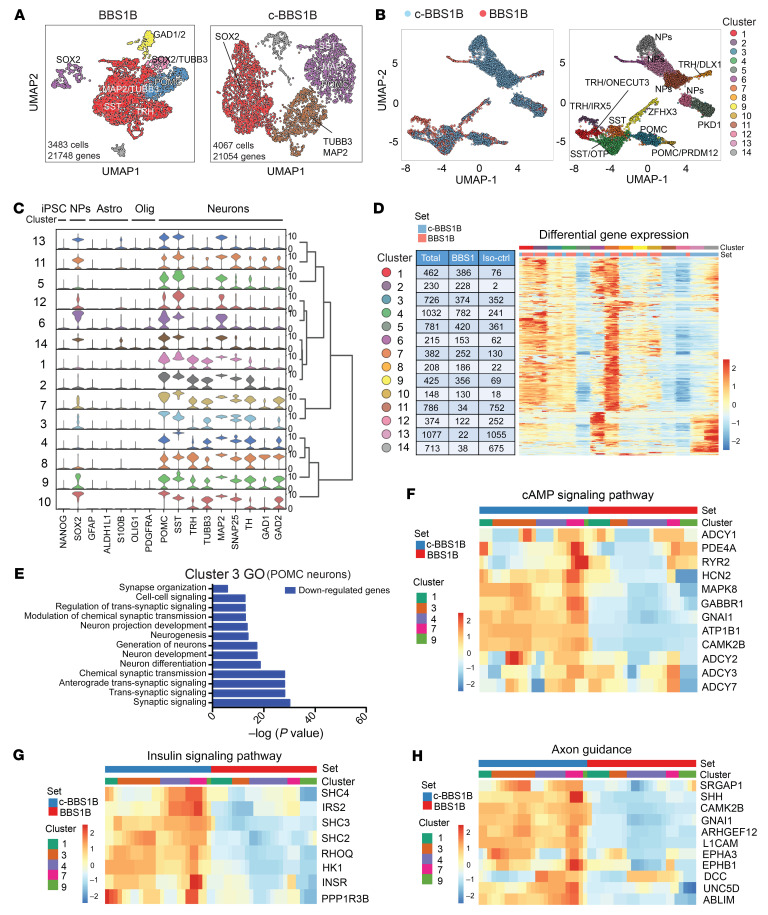
Figure 2. scRNA-seq analysis of BBS iPSC–derived hypothalamic neurons.
(A) Uniform manifold approximation and projection (UMAP) of BBS1B and isogenic control (c-BBS1B) iPSC–derived hypothalamic neurons. (B) UMAP of BBS1B and c-BBS1B neurons after integration and identification of 14 clusters. Marker genes and cell types for each cluster are indicated. (C) Violin plots of cell-type-specific markers for all 14 clusters and hierarchical clustering. Signature genes for iPSCs, neuronal progenitors (NPs), astrocytes (Astro), oligodendrocytes (Olig), and neurons are included. (D) Heatmap of differentially expressed genes in all clusters. Number of cells from which line within each cluster is indicated in the table. (E) Gene Ontology analysis of downregulated genes (BBS1B/c-BBS1B) identified in cluster 3. (F–H) Heatmaps of genes of pathways highlighted in KEGG pathway analysis. Genes involved in cAMP signaling pathway (F), insulin signaling pathway (G), and axon guidance (H) were plotted against cell set and cluster ID.

