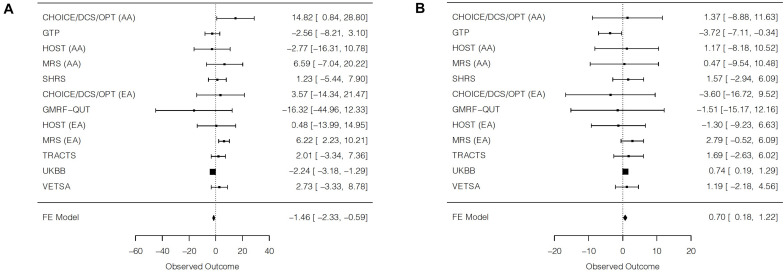
FIGURE 2.
Forest plots of trans-ethnic meta-analyses for the main effect of posttraumatic stress disorder symptoms on (A) systolic blood pressure and (B) diastolic blood pressure. For each cohort, a square is plotted at the effect estimate value. The size of each plotted square reflects relative precision, where size is inversely proportional to the standard error of a given cohort. Reported effects are beta coefficients and 95% confidence intervals. AA = African ancestry; EA = European ancestry; FE = fixed effects.

