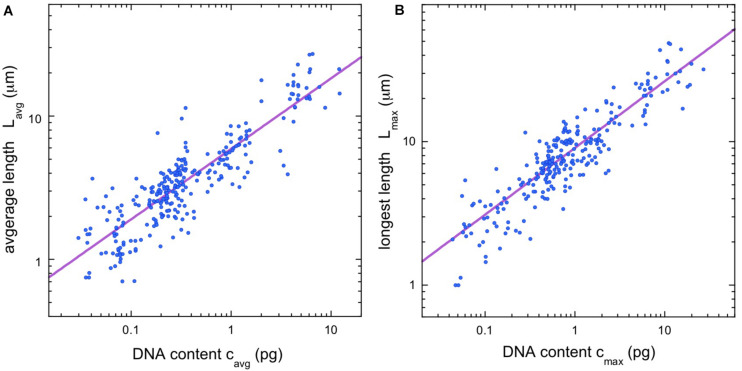
FIGURE 1.
Chromosome length scaling in vertebrates. (A) Average chromosome length vs average chromosomal DNA content. The regression line (violet) corresponds to a power law, Lavg = aLavg (cavg)α, with the constant aLavg = 5.93 and the exponent α = 0.492 (95% confidence intervals 5.81–6.16 and 0.480–0.510, respectively, N = 281). (B) Length of longest chromosome vs. estimated DNA content. The regression line (violet) corresponds to a power law, Lmax = aLmax (cmax)α, with the constant aLmax = 9.07 and the exponent α = 0.465 (95% confidence intervals 8.80–9.22 and 0.458–0.484 respectively, N = 256). All regressions calculated using Siegel’s repeated medians (Siegel, 1982), a nonparametric technique that is insensitive to outliers.

