FIGURE 3.
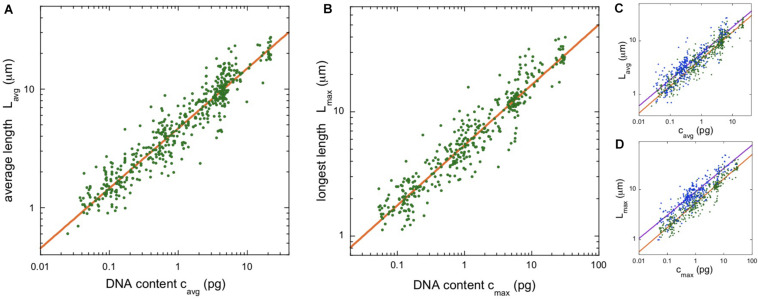
Chromosome length scaling in angiosperms (flowering plants). (A) Average chromosome length vs average chromosomal DNA content. The regression line (orange) corresponds to a power law, Lavg = aLavg (cavg)α, with the constant aLavg = 4.64 and the exponent α = 0.506 (95% confidence intervals 4.61–4.72 and 0.498–0.509, respectively, N = 504). (B) Length of longest chromosome vs estimated DNA content. The regression line (orange) corresponds to a power law, Lmax = aLmax (cmax)α, with the constant aLmax = 5.37 and the exponent α = 0.485 (95% confidence intervals 5.33–5.46 and 0.479–0.491, respectively, N = 380). (C,D) Overlay of the length scaling plots for vertebrates (blue) and angiosperms (green).

