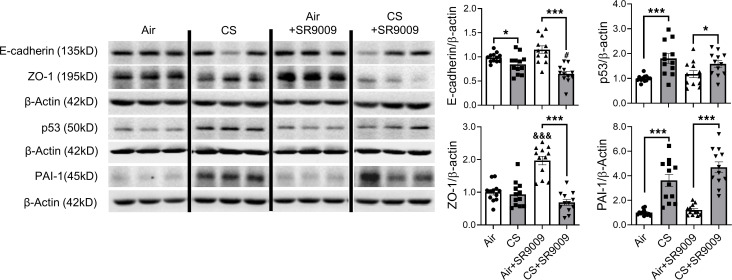
Figure 10. Protein abundance of EMT markers were affected by acute CS exposure.
Lungs from mice exposed to CS for 10 days with SR9009 administration were homogenized, and protein abundance were measured by Western blotting. Representative blot images are shown, and relative protein fold changes of E-cadherin, ZO-1, p53, and PAI-1 are analyzed based on densitometry with β-actin as the endogenous control. E-cadherin and ZO-1 were probed in the same membrane. Different groups were run on the same membrane, but were noncontiguous. Data are shown as mean ± SEM (n = 11–12. *P < 0.05, ***P < 0.001 between groups; &&&P < 0.001 compared with WT air controls; 1-way ANOVA with Šidák correction).

