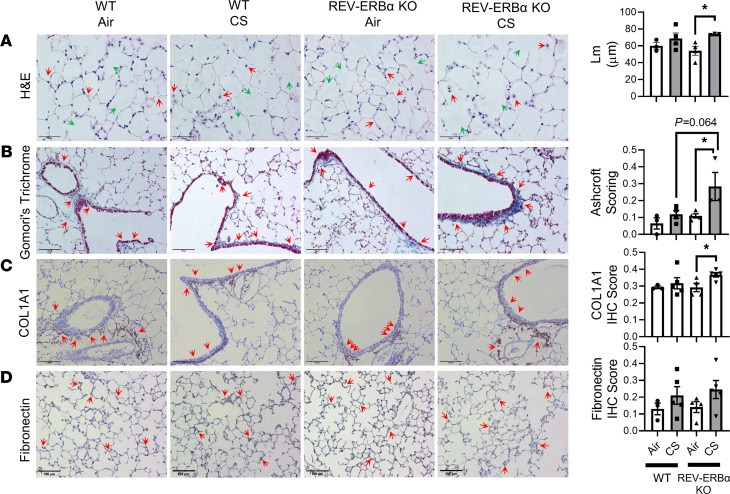
Figure 6. Airspace enlargement and abnormal ECM deposition were induced by subchronic CS exposure in REV-ERBα–KO mice.
Subchronic 30 days of CS exposure induced airspace enlargement observed by (A). H&E (original magnification, ×40; scale bar: 50 μm) (green arrows indicated airspace enlargement and red arrows indicated inflammatory responses) and abnormal ECM deposition observed via B. Gomori’s Trichrome (original magnification, ×20) staining (scale bar: 100 μm) (C). IHC staining COL1A1 (original magnification, ×20; scale bar: 100 μm) (D). Fibronectin (original magnification, ×20; scale bar: 100 μm). Relative IHC score based on positive staining intensity was performed in a blind manner and denoted by red arrows. Data are shown as mean ± SEM (n = 3–4/group, *P < 0.05; 1-way ANOVA with Šidák correction).

