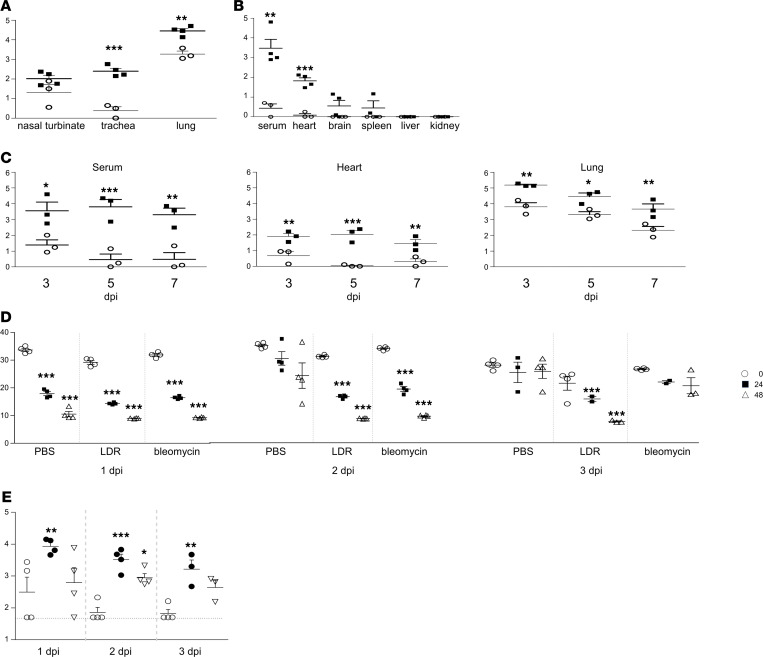
Figure 5. Viral RNA levels and viability.
(A–C) Viral RNA levels in various tissues. RT-PCR was performed on tissue homogenates prepared from SARS-CoV-2 mice (empty circles) and LDR–SARS-CoV-2 mice (filled squares) at 2 days after infection (A and B) or at 3, 5, and 7 days after infection (C). A PFU calibration curve tested in parallel was utilized to express Ct values as calculated PFUs. (D) Viral growth kinetics. Lung homogenates prepared from SARS-CoV-2, LDR–SARS-CoV-2, and bleomycin–SARS-CoV-2 mice at 1–3 days after infection were monitored for the presence of viable virus in an in vitro Vero E6 cell culture–based growth kinetics assay (see Methods). Decreasing Ct values over time determined by RT-PCR of cell growth medium samples collected at 0, 24, and 48 hours indicate viral replication in the Vero cells. Asterisks represent statistical significance between adjacent time points of sampling (24 hours compared with t = 0, 48 hours compared with 24 hours) (E) Subgenomic mRNA analysis. Quantitative RT-PCR of E gene sgmRNA was performed on sham-treated (empty circles), LDR-treated (filled circles), and bleomycin-treated (empty triangles) mice lung homogenates prepared 1–3 days after infection with SARS-CoV-2 (5 × 10⁶ PFU/mouse) Asterisks represent statistical significance in comparison to sham-treated mice (empty circles). Data represent mean ± SEM, n = 3–4 per group, analyzed using 2-way ANOVA followed by Bonferroni’s posttests, *P < 0.05, **P < 0.01, ***P < 0.001.

