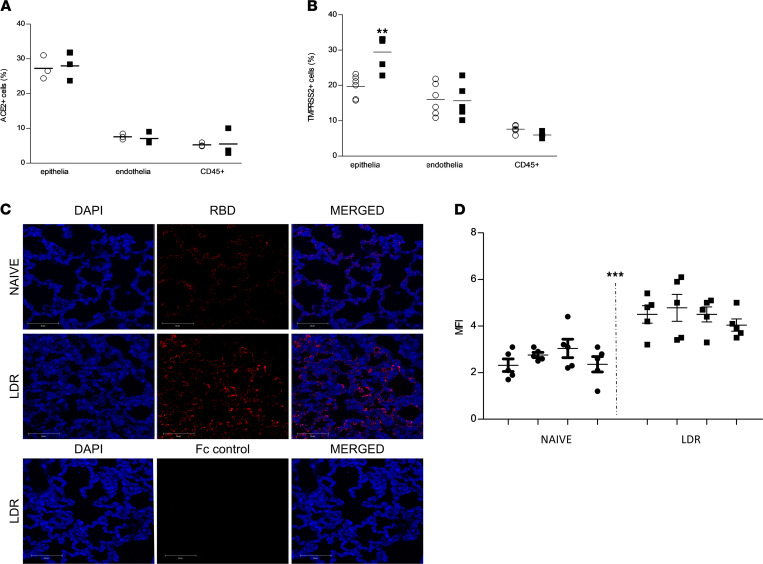
Figure 7. Expression of ACE2 and TMPRSS2 and RBD binding in lung cells of LDR mice.
(A and B) Flow cytometry analysis of lung cells harvested from LDR (filled bars) and sham-treated (empty bars) mice 2 days after treatment. ACE2 (A, n = 3), TMPRSS2 (B, n = 6). Data referring to percentage of positive cells out of the indicated cell types are presented as mean ± SEM, analyzed using 2-way ANOVA followed by Bonferroni’s posttests, **P < 0.01. (C and D) Confocal microscopy scans of lung sections. (C) Sections from LDR (2 days after LDR administration) and naive mice were incubated with RBD-huFc or AChE-huFc (Fc control) and then immunostained with anti-human AF594. Staining of RBD in red and identification of nuclei by DAPI in blue. Scale bar: 50 μm. (D) Scatterplots of the fluorescence staining intensities of RBD expressed as MFI ± SEM. n = 4 mice, 5 scanned fields/lung, analyzed using unpaired t test, ***P < 0.001.

