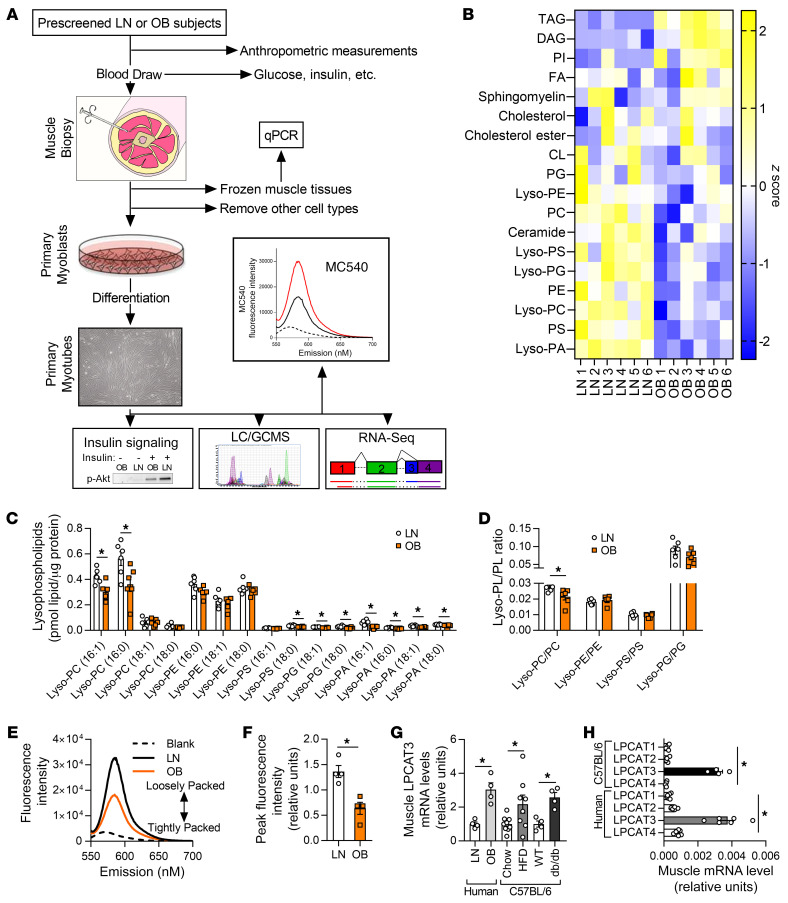
Figure 1. Lipidomic analyses of skeletal muscle samples from human subjects who were lean or with obesity.
(A) A schematic of the workflow for the clinical study. LC/GCMS, liquid chromatography/gas chromatography-mass spectrometry. (B–D) Lipidomic analysis of HSkMCs from subjects who were insulin-sensitive and lean (LN) or insulin-resistant with obesity (OB). (B) Heatmap of lipid content by class. CL, cardiolipin; DAG, diacylglycerol; FA, fatty acid; Lyso-PA, lysophosphatidic acid; Lyso-PC, lysophosphatidylcholine; Lyso-PE, lysophosphatidylethanolamine; Lyso-PG, lysophosphatidylglycerol; Lyso-PS, lysophosphatidylserine; PC, phosphatidylcholine; PE, phosphatidylethanolamine; PG, phosphatidylglycerol; PI, phosphatidylinositol; PS, phosphatidylserine; TAG, triacylglycerol. (C) Species of lysophospholipids. (D) Lysophospholipid/phospholipid ratio (n = 6). (E and F) Quantification of MC540 fluorescence in LN and OB HSkMCs (n = 4). (G) LPCAT3 mRNA in muscle biopsies from LN or OB subjects (left), in skeletal muscle of WT mice fed standard chow or high-fat diet (HFD) (middle), and in skeletal muscle of WT or db/db mice (right) (LN and OB: n = 4; chow: n = 9; HFD: n = 8; WT and db/db: n = 4). (H) Expression of all isoforms of LPCAT in muscle samples from mouse (n = 4) or human (n = 6) skeletal muscle. Two-tailed t tests (C, D, F, and G) or 1-way ANOVA followed by post hoc multiple comparisons (H) was performed. All data are represented as mean ± SEM. *P ≤ 0.05.

