
Figure 1: Whole exome sequencing of multi-region low-grade (LG) and high-grade (HG) IPMN samples.
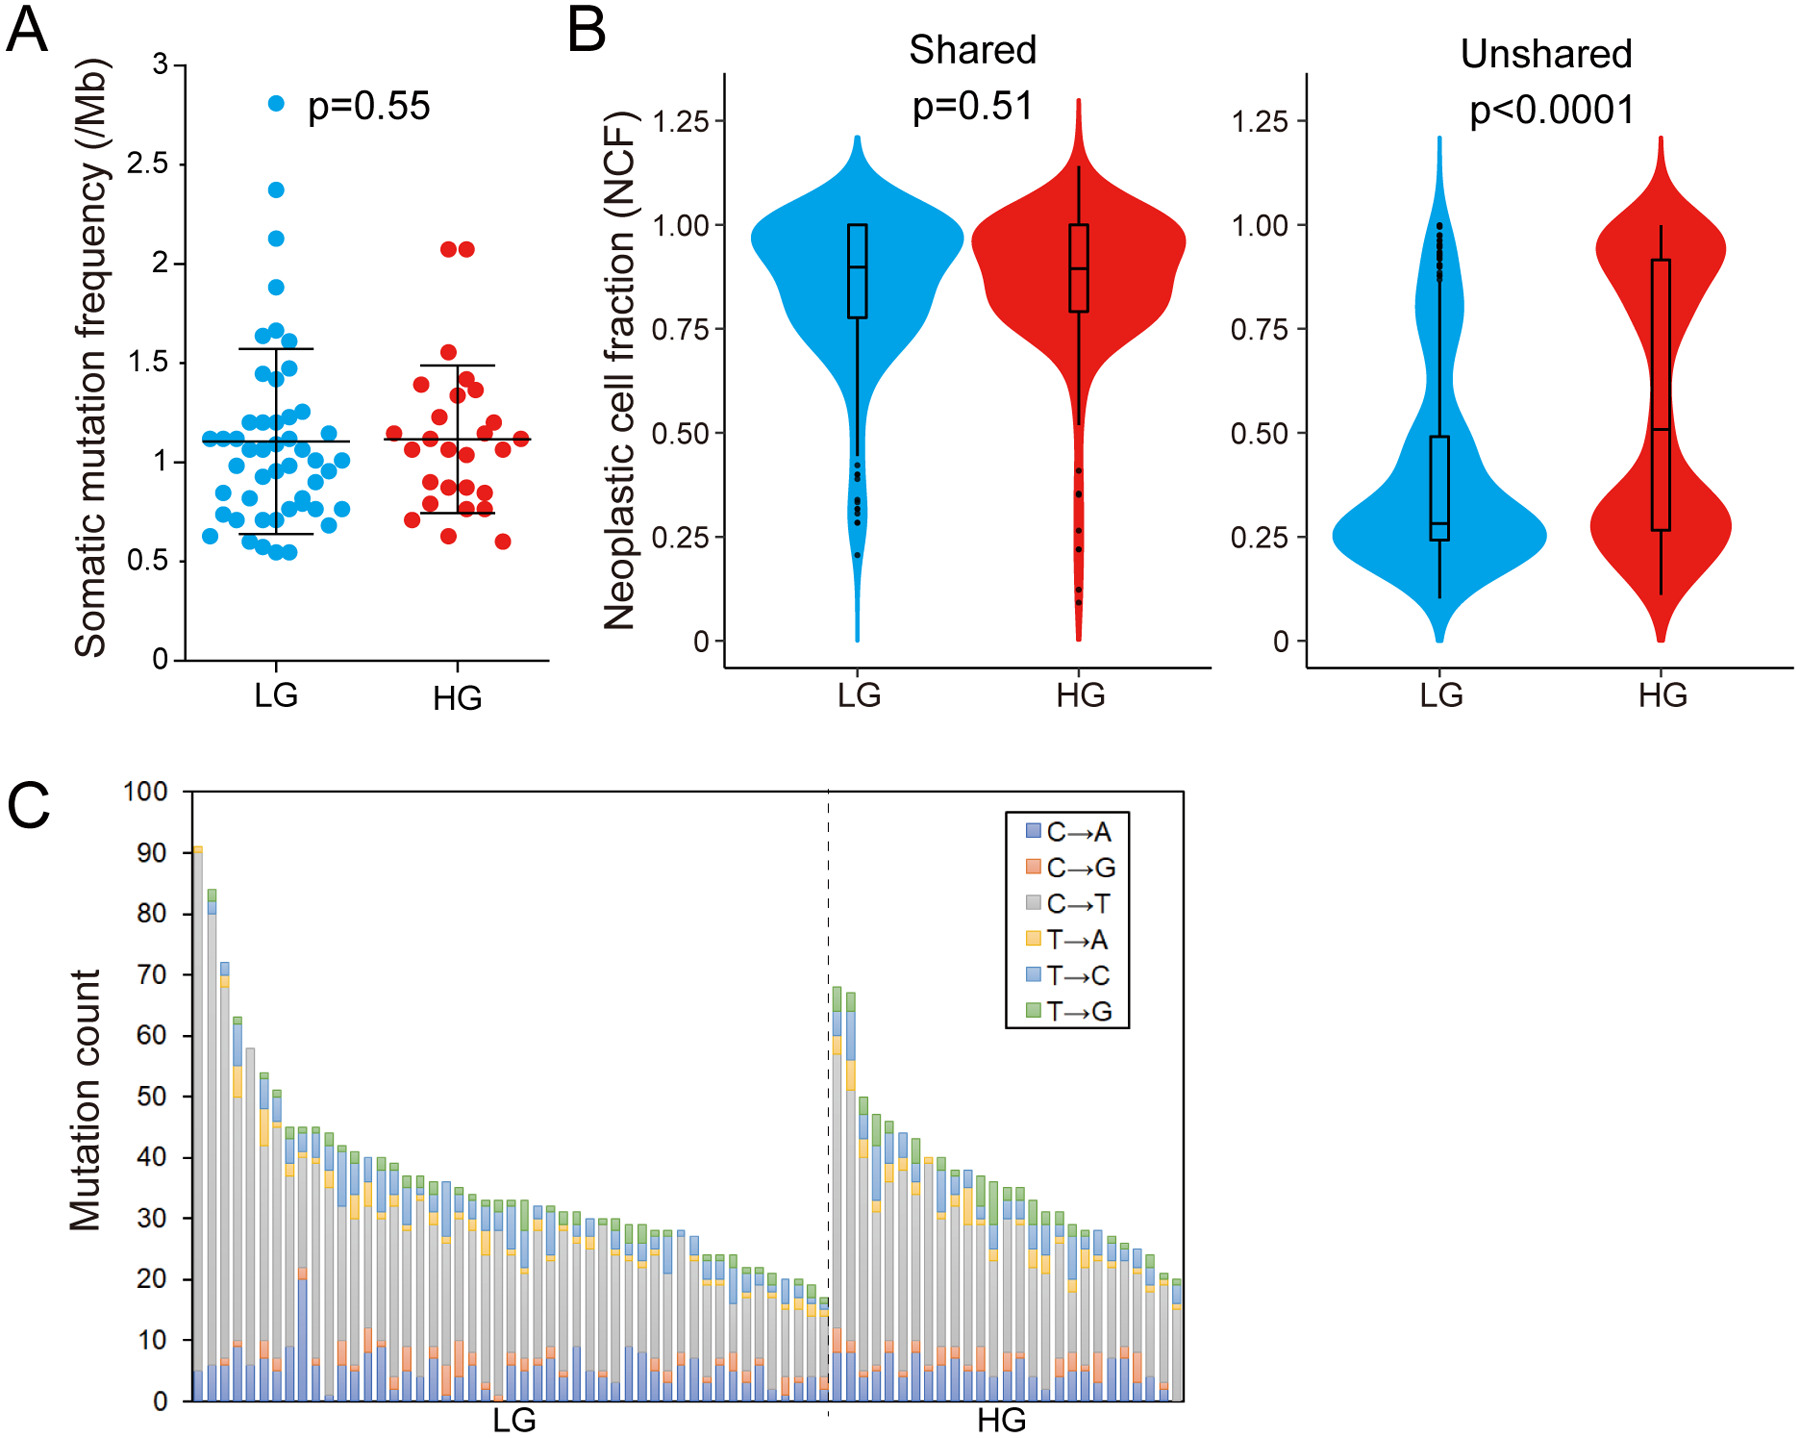
(A) Comparison of the tumor mutation burden per megabase (TMB/Mb) between LG (n=49) and HG (n=27) IPMN regions. The lines and error bars indicate mean ± 1 standard deviation. (B) Violin plots showing the neoplastic cell fraction (NCF) of all mutations detected in LG (n=49) and HG (n=27) regions. The NCFs were calculated separately for shared mutations among all regions (left panel) and unshared mutations (right panel). (C) Proportion of base changes observed in each IPMN sample. Samples are organized by grade of dysplasia and descending total number of alterations.