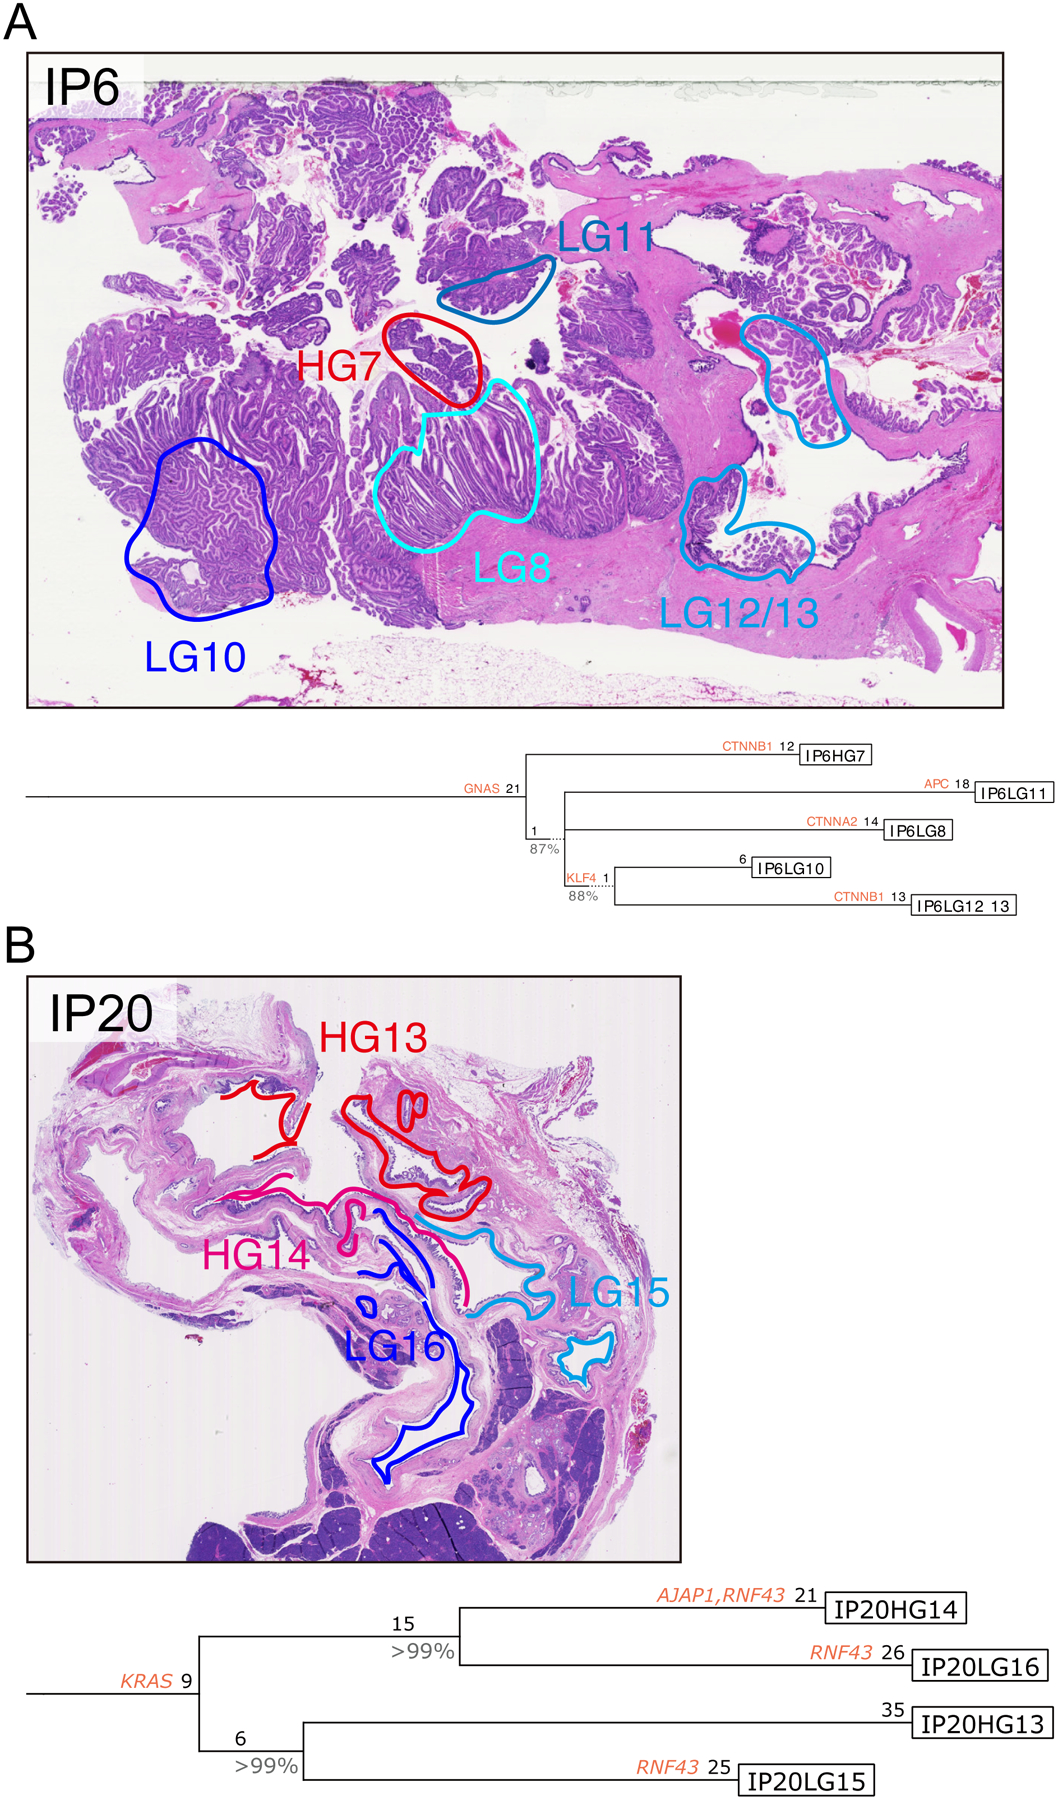
Figure 6: Representative IPMN phylogenies constructed using Treeomics.

Treeomics generated phylogenetic trees from all nonsynonymous mutations identified in each IPMN region (A, IP6; B, IP20). Potential driver gene mutations (including those identified in previous pancreatic cancer genomics studies, as well as those mutated in >3 IPMNs and >0.5 mutations per kb gene size in the current study) are indicated by their gene name on the lineage in which they occur. Numbers indicate the number of nonsynonymous somatic mutations occurring in each trunk or branch. Representative images of neoplastic tissue stained by hematoxylin and eosin are presented for both cases, with colored circles indicating the microdissected regions for sequencing analysis.
