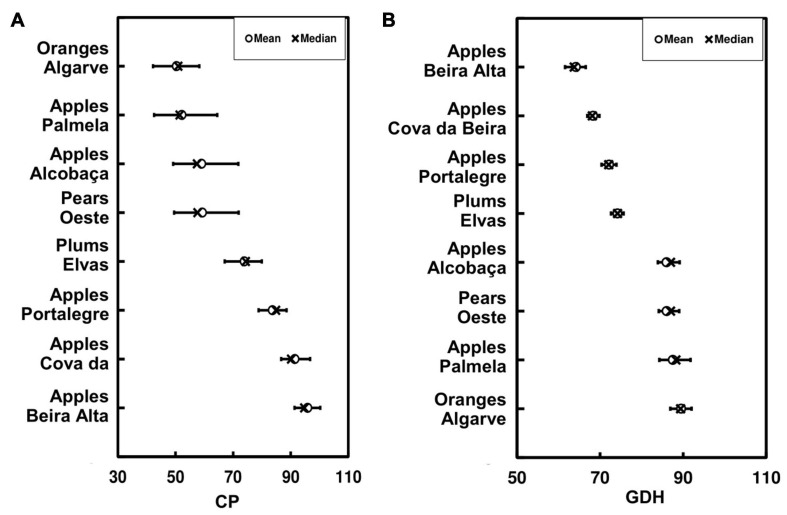
FIGURE 3.
Boxplots representing the chilling portions (CP) (A) and growing degree hours (GDH) (B) over the selected eight fresh fruit regions. The regional mean (circle) and median (cross) are depicted, as well as the minima and maxima (outer dashes). The regions are ranked from the lowest to the highest mean values of SWC and SHF, respectively. GDH and SHF values are shown in ×103.

