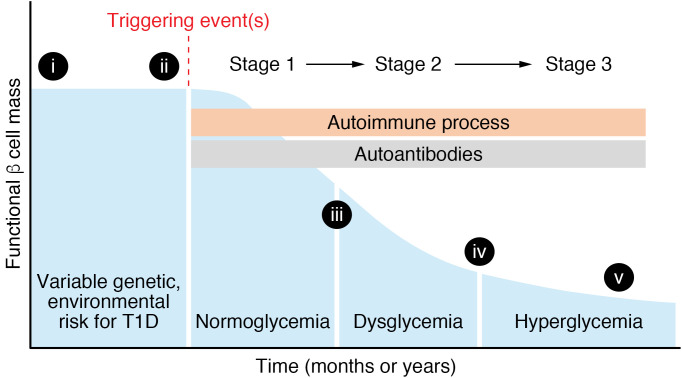
Figure 1. Model of stages of type 1 diabetes (T1D).
Graph shows functional β cell mass through the stages of T1D. The blue shaded area shows number or insulin secretory capacity of β cells, with time on the x axis reflecting a broad range (could be months or years of T1D development). See text for definition of T1D stages. Roman numerals on the graph refer to questions about T1D pathogenesis shown in Table 1.

