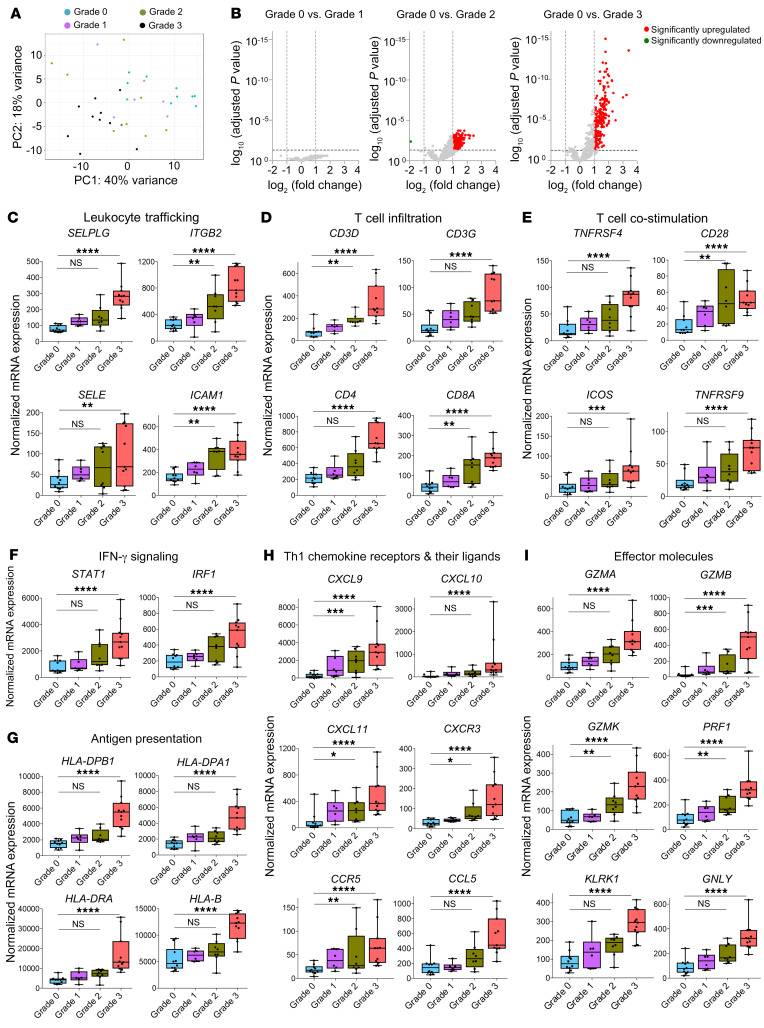
Figure 3. Comparison of acute rejection stages demonstrates that distinct gene expression patterns develop in grade 2 and grade 3 rejections.
(A) Unsupervised principal component analysis clustered all grade 3 samples (n = 11) separately from grade 0 biopsies (n = 10), but grade 1 (n = 6) and grade 2 biopsies (n = 8) were molecularly heterogeneous. (B) Volcano plots showing DEGs in grade 1, 2, and 3 rejections in relation to grade 0 samples. DEGs were obtained using normalized gene expression counts as input and the Wald significance test. (C–I) Box plots of normalized expression values of genes associated with leukocyte trafficking (C); T cell infiltration (D); T cell costimulation (E); IFN-γ signaling (F); antigen presentation (G); Th1 chemokine receptors and their ligands (H); and effector molecules (I). Horizontal lines represent median values, with whiskers extending to the farthest data points. Adjusted *P ≤ 0.05, **P ≤ 0.01, ***P ≤ 0.001, ****P ≤ 0.0001. The full lists of DEGs and associated statistics are shown in Supplemental Tables 3 and 7.

