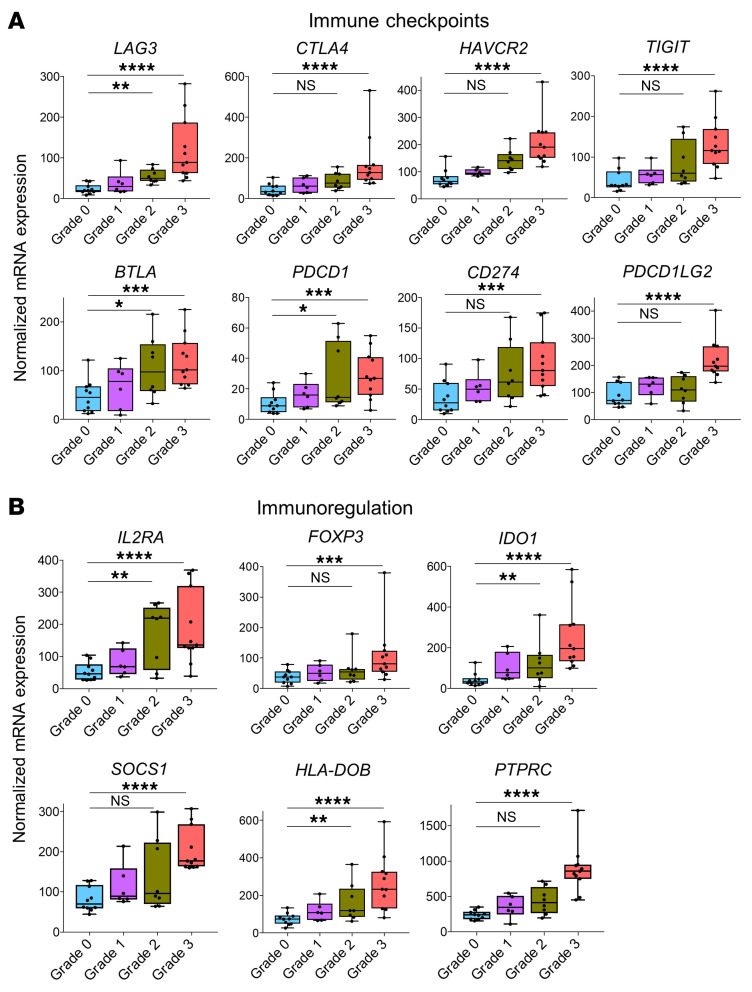
Figure 4. Immune checkpoint molecules and immunoregulatory genes are upregulated in face transplant rejection.
Box plots of normalized expression values of genes associated with immune checkpoints (A) and genes associated with regulation of the immune response (B). Normalized gene expression values are shown for biopsies collected during grade 0 (n = 10), grade 1 (n = 6), grade 2 (n = 8), and grade 3 rejection (n = 11). Horizontal lines represent median values, with whiskers extending to the farthest data points. Adjusted *P ≤ 0.05, **P ≤ 0.01, ***P ≤ 0.001, ****P ≤ 0.0001. The full lists of DEGs and associated statistics are shown in Supplemental Tables 3 and 7.

