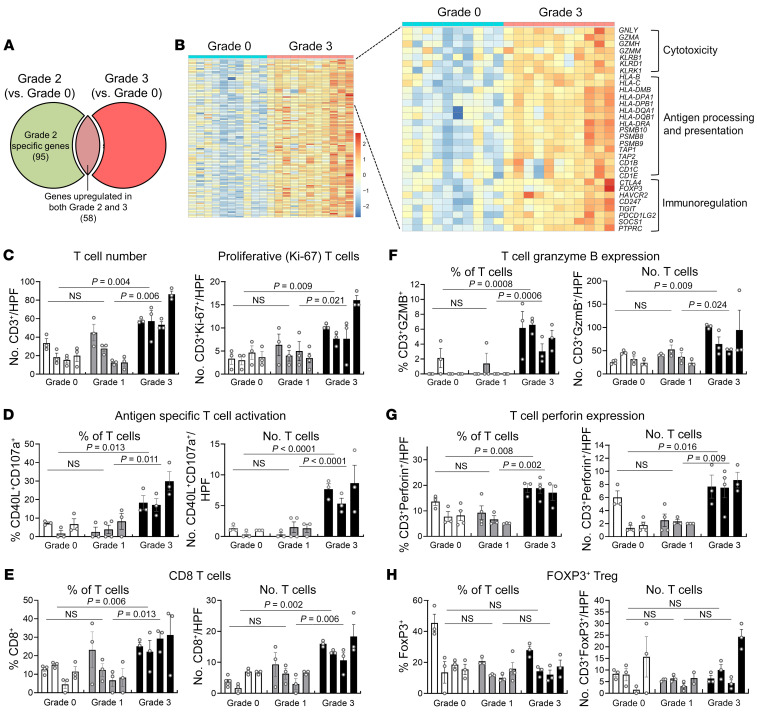
Figure 5. Severe rejection is characterized by upregulation of cytotoxicity, antigen presentation, and immunoregulation genes and infiltration of skin by proliferating T cells expressing markers of antigen-specific activation and cytotoxic effector molecules.
(A) Venn diagram showing shared and unique DEGs in grade 2 (n = 8) and grade 3 (n =11) biopsies (when compared with grade 0 samples). DEGs were obtained using normalized gene expression counts as input and the Wald significance test. One hundred seven genes were exclusively differentially expressed in grade 3 rejection. (B) Heatmap of 107 genes that are uniquely differentially expressed in grade 3 rejection, which included genes associated with cytotoxicity, antigen processing and presentation, and immunoregulation. Each column represents a biopsy. Gene expressions values are row scaled. (C–H) Multiplex immunostaining of grade 0, 1, and 3 rejection demonstrates the infiltration of proliferative, activated, and cytotoxic T cells in grade 3 skin biopsies but no significant differences between grades 0 and 1. Bars represent individual donors, and error bars represent the mean and SEM of at least 3 separate measurements per donor. (C) The numbers of total (CD3+) and proliferative (CD3+Ki-67+) T cells per ×200 high-power field (HPF) are shown. (D–H) The relative percentages (left) and absolute numbers per HPF (right) of T cells expressing markers of antigen-specific activation (CD40L+CD107a+) (D), CD8 (E), granzyme B (F), perforin (G), and the Treg marker FOXP3 (H) are shown. Significance was determined by nested 1-way ANOVA and Tukey’s post hoc test for comparison between grades.

