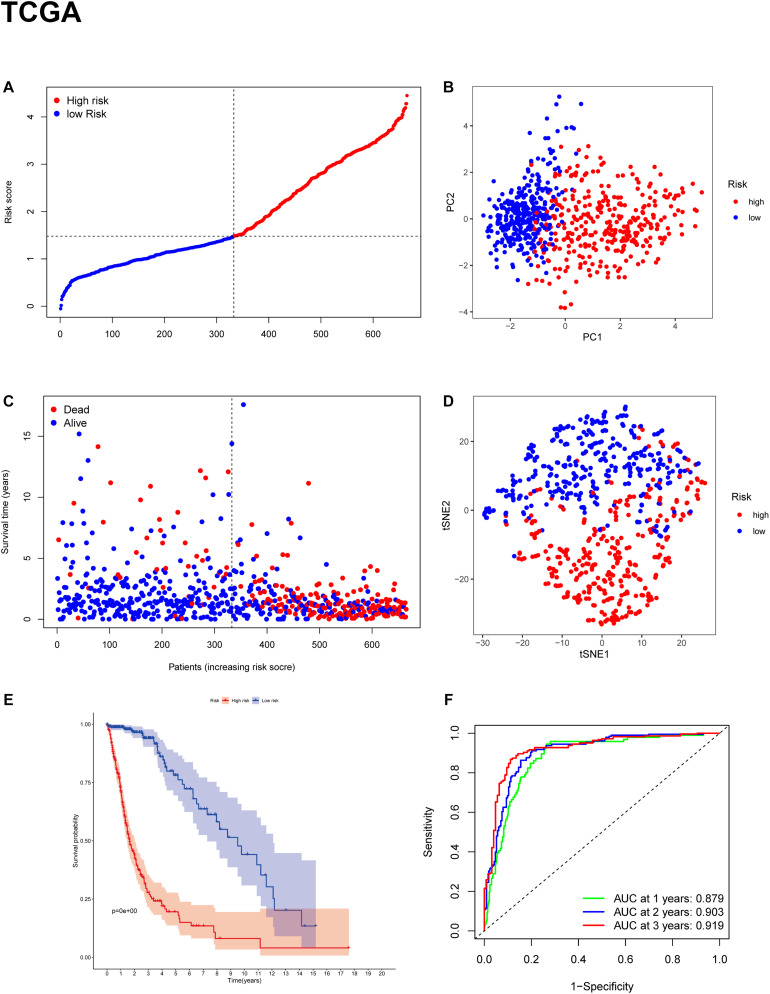
FIGURE 3.
Construction of the gene signature in the TCGA cohort. (A,C) Distribution and median value of risk scores in the TCGA cohort. (B) PCA plot of the TCGA cohort. (D) t-SNE analysis of the TCGA cohort. (E) Kaplan-Meier survival curve for the OS of patients in the high-risk group (red line) and low-risk group (blue line) in the TCGA cohort. (F) AUC of time-dependent ROC curve analysis for evaluating the prognostic performance of the risk score for OS in the TCGA cohort.

