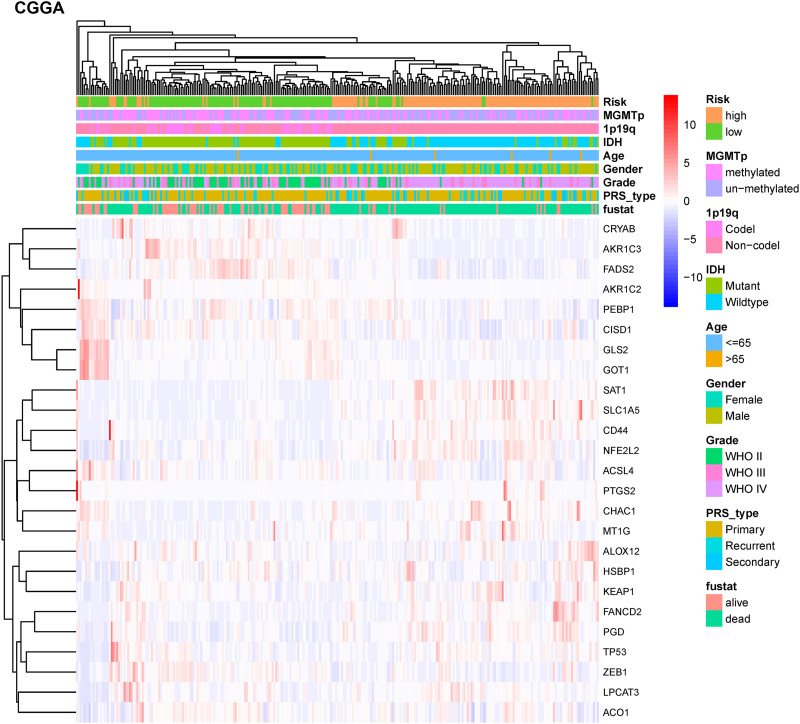
FIGURE 5.
Hierarchical clustering showing correlation between signature risk score, different expression levels of selected ferroptosis-related genes, and clinical or molecular features in the CGGA dataset. Heatmap showed the different expression levels of 25 ferroptosis-related genes and clinical or molecular pathological features using hierarchical clustering in CGGA dataset. Methylguanine methyltransferase promotor (MGMTp); isocitrate dehydrogenase (IDH); co-deletion (Codel); without co-deletion (Non-codel); primary/recurrent/secondary type of glioma (PRS_type); survival status (fustat).

