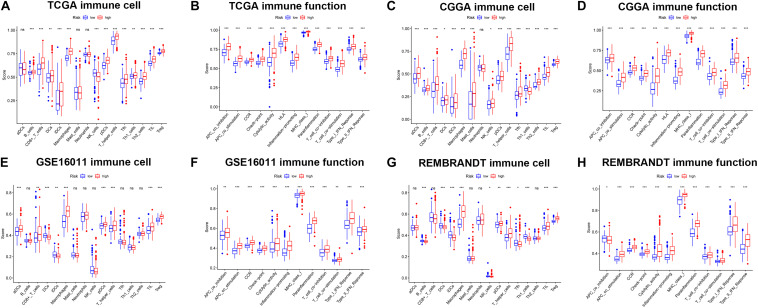
FIGURE 8.
The ssGSEA results of different risk groups in the TCGA cohort (A,B), CGGA cohort (C,D), GSE16011 cohort (E,F), and REMBRANDT cohort (G,H). The scores of 16 immune cells (A,C,E,G) and 13 immune-related functions (B,D,F,H) were shown in boxplots. Adjusted p were showed as: ns, not significant; *p < 0.05; **p < 0.01; ***p < 0.001.

