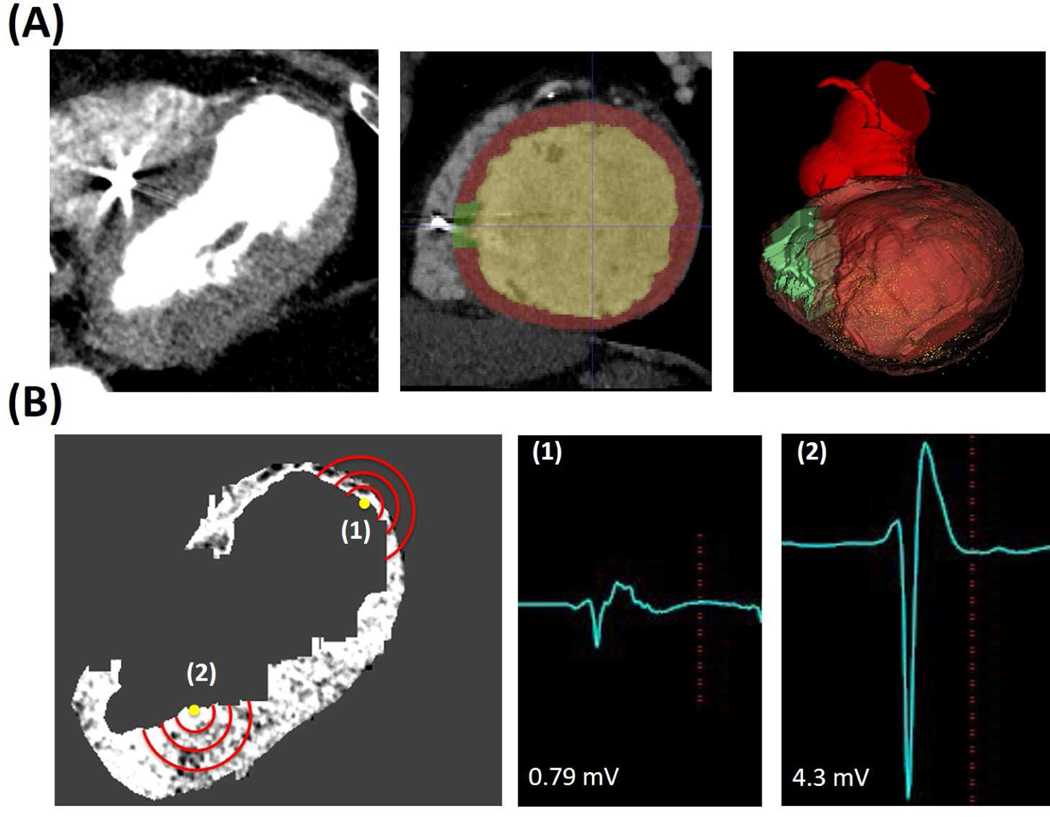
Figure 1: Registration of CE-CT to Electroanatomic Map and Field of View Analysis.
Panel A: CE-CT Segmentation with isolation of ICD lead artifact for exclusion in subsequent analysis and generation of myocardial mesh. Left image shows CE-CT, middle image shows representative segmentation (green = artifact, red = myocardium, yellow = blood pool), and right image shows resulting myocardial model registered to the electroanatomic map (yellow dots indicate mapping points). Panel B: Representative image showing co-registered EAM points on CE-CT with different analysis radii (red lines) and associated electrograms.

