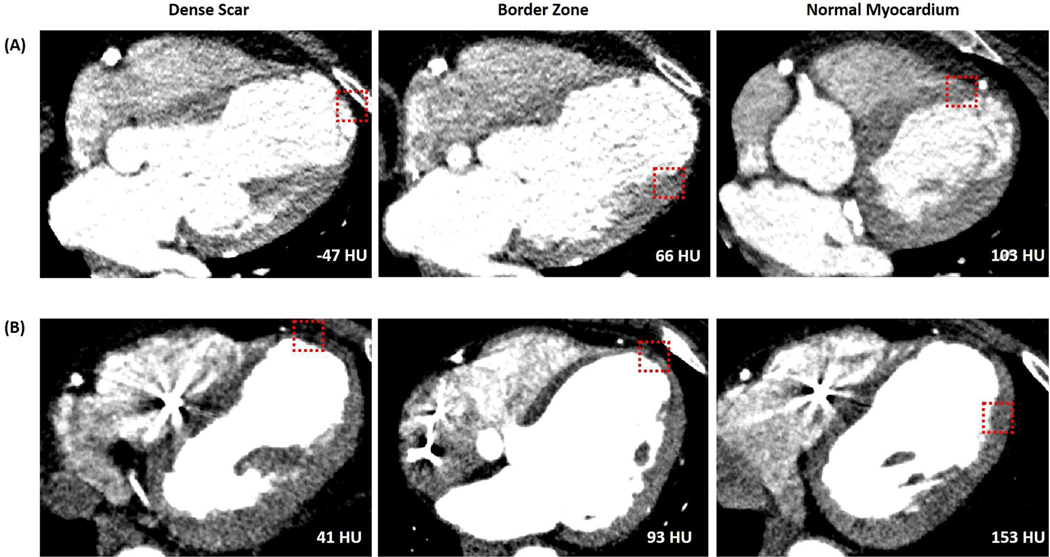
Figure 3: Examples of Myocardial Characteristics on CE-CT at Scar, Border Zone, and Normal Myocardium.
Examples of myocardial characteristics on CE-CT at scar, border zone, and normal myocardium (left to right) as defined by endocardial voltage. (Panel A) Patient in whom mapping was performed with a Thermocool ablation catheter. (Panel B) Patient in whom mapping was performed using a PentaRay. Red box highlights location of electroanatomic mapping point and the associated attenuation at an analysis radius of 5 mm is shown on each image.

