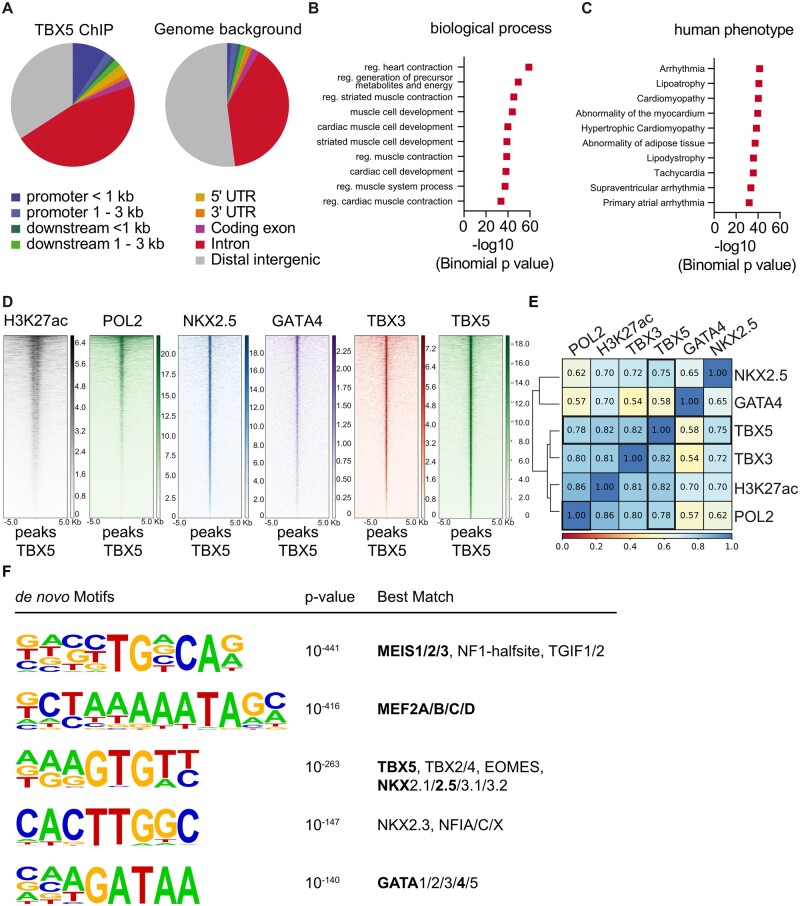
Figure 4.
Chromatin Immunoprecipitation analysis of endogenous TBX5 in the adult mouse ventricle. (A) Analysis of enriched genomic locations upon TBX5-ChIP shows that TBX5 preferably binds to promoter sites, downstream of the gene body, in the 5ʹ UTR and intronic regions (CEAS package20 on Cistrome). TBX5-bound regions were annotated to genes using GREAT.21 These regions were analysed for the 10 most enriched biological process clusters (B) and the 10 most enriched human disease phenotype clusters (C) of TBX5 peaks. (D) Heatmaps showing that TBX5 bound regions are highly co-occupied by marks of active enhancers (H3K27ac, POL2),25 known cofactors (NKX2.5, GATA4) and TBX324; analysed data from previously published datasets. (E) Statistical analysis of co-occupancy showing Pearson’s correlation coefficients. The scale bar in (B) depicts normalized RPKM values and in (C) co-occupancy percentage. (F) De novo motif analysis by HOMER of total TBX5 bound regions. The scale bar in (B) depicts normalized RPKM values and in (C) co-occupancy percentage. Results are displayed in (D) as heatmaps using deeptools in Galaxy and in (E) as the statistical analysis of co-occupancy showing Pearson’s correlation coefficients.

