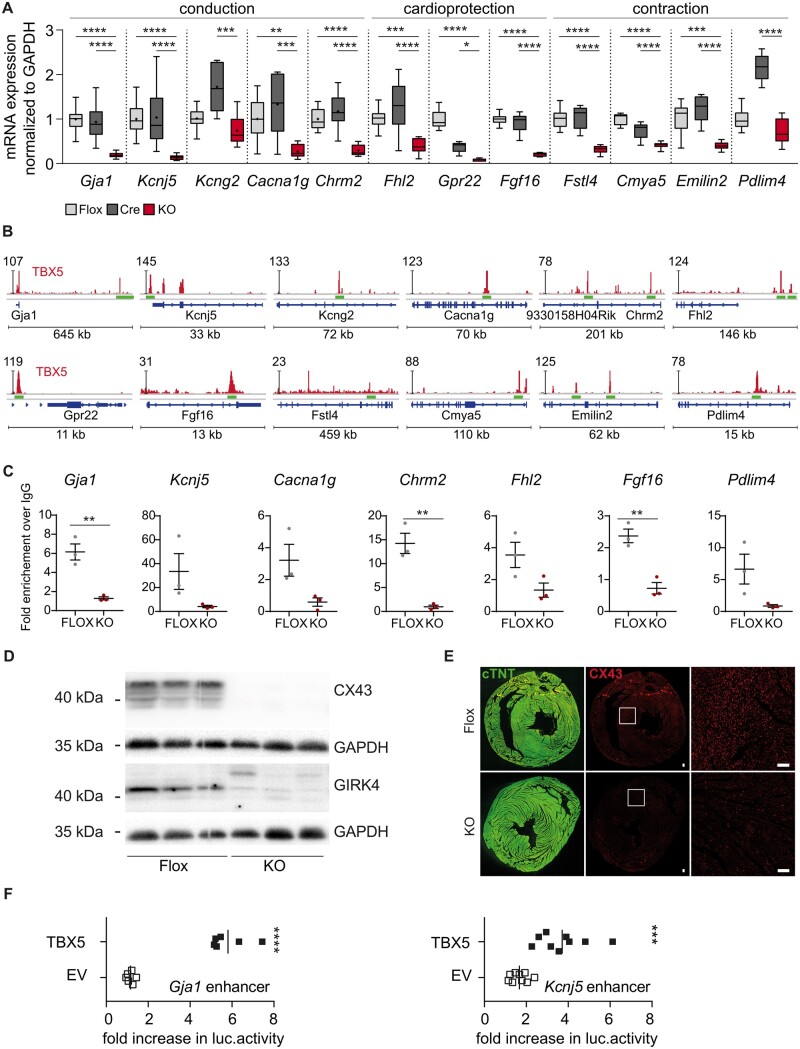
Figure 6.
Validation of the newly identified ventricular TBX5 target genes. (A) Validation of target gene expression by RT-(q)PCR (Flox, light grey n = 13; Cre, dark grey, n = 11; vTbx5KO, red, n = 10). (B) Visualization of the corresponding TBX5 peaks related to the 47 down-regulated genes described using IGV. The TBX5-ChIP-Seq lane is displayed in red and gene features in blue. The peaks that were investigated further are indicated with green bars. Immunoblot analysis of CX43, GIRK4, and GAPDH shows a strong down-regulation of CX43 and GIRK4 in vTbx5KO mice. Representative blot of n = 6 per group. (C) ChIP-qPCR analysis of the novel TBX5 enhancer regions in vTbx5KO mice vs. Flox ventricles (n = 3 biological replicates/group). (D) Immunoblot analysis of CX43, GIRK4, and GAPDH shows a significant down-regulation of CX43 and GIRK4 in vTbx5KO mice. Representative blot of n = 6 per group. (E) CX43 expression is strongly reduced in the ventricle of vTbx5KO mice shown by immunofluorescence staining for CX43 (red) and cTNT (green). Scale bar: 50 µm. (F) Gja1 and Kcnj5 enhancer activity analysis by luciferase measurements show enhancement of luciferase expression by TBX5 co-transfection (n = 9 technical replicates/3 independent experiment). EV: expression vector pCMV2c-flag, and TBX5: pCMV2c-TBX5-flag. Data are presented as mean ± SEM. Statistical analysis was performed by (A) one-way ANOVA for each transcript followed by Tukey’s multiple comparison post hoc test; (C, F) unpaired, two-tailed Student’s t-test, *P < 0.05, **P < 0.01, ***P < 0.001, ****P < 0.0001.

